by Pranab Bardhan
All of the articles in this series can be found here.
 Sometime before Ashok Rudra and I started on our large-scale data collection, I was already doing some theoretical and conceptual work on agrarian relations. My first, mainly theoretical, paper on share-cropping (jointly with TN) came out in American Economic Review in 1971. That paper was unsatisfactory and had quite a few loose strands, but it was one of the first papers to look theoretically into an economic-institutional arrangement of a developing country at the micro-level. This was a time when development economics was preoccupied with macro-issues like the structural transformation of the whole economy involving transition from agriculture to industrialization or problems of its aggregate interaction with more developed economies.
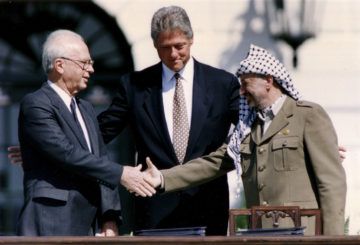
In a short trip abroad I presented my work on share-cropping in a seminar at Yale where my friend, Martin Weitzman who was teaching there, was present. He later told me that it made him start thinking of a more general context, that of sharing profits or revenues with workers in a modern firm that might resolve some macro-economic problems like unemployment—he later came out with a book on this titled The Share Economy.
Joe Stiglitz by that time had also moved to Yale, and asked me to stay overnight with him after my talk. That night at his home kitchen, as he was washing the dishes after our dinner, we kept on talking on various aspects of share-cropping. I told him that to me share-cropping was clearly an inefficient institution in agriculture, and yet it had been around for millennia in different parts of the world. We were both wondering why. Joe started looking at it from his point of view of imperfect information (the landlord unable to monitor how much effort the peasant put in). That led to his chain of thinking which ultimately produced his classic paper on share-cropping in 1974. Read more »
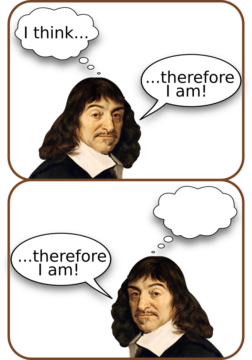
 A provocative title, perhaps, and perhaps also counterintuitive. One thinks in the language one speaks, everybody knows that. Why would anyone ask bilingual speakers which language they think in (or dream in) otherwise?
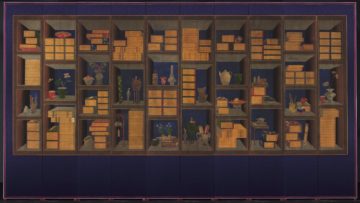
 The slim, green book Natural History of Western Massachusetts is one of my favorites. Compressed into its hundred odd pages are articles and visuals that describe the essential natural features of the Amherst region, where I’ve lived since 2008. I turn to it every time something outdoors piques my interest — a new tree, bird or mammal, a geological feature.
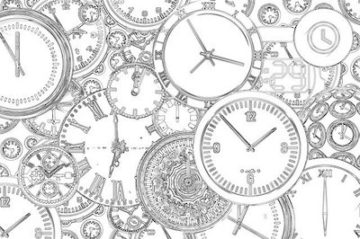 Everything in the universe that’s visible from your location on Earth passes by overhead every day. We’re usually able see only the stars, galaxies, planets, and so on that are in the sky when the sun is not; we become aware of them when the sun sets and Earth’s shadow rises from the eastern horizon. But all of them are there at some point in the day. We picnic beneath the winter constellation Orion in summer and walk beneath the Summer Triangle on the short days of winter. The moon also crosses the sky every day, sometimes in the daytime, and sometimes too close to the sun to be seen.
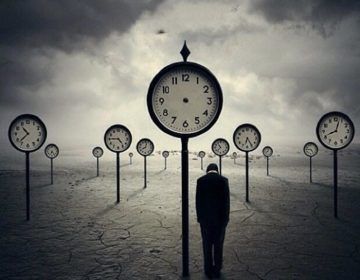
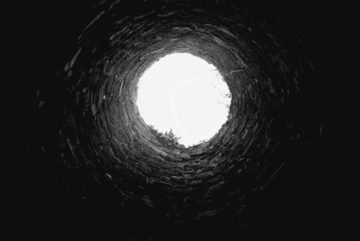 I had my first panic attack at age sixteen, which was (deargod) over 35 years ago. It happened during school, much to my teenage mortification. Some friends and I were hanging out in our high school newspaper office during a free period, sprawled on one of the crapped-out couches under the blinking fluorescent lights, just shooting the shit. All of a sudden, a wave of horror swept over me—no, that’s not the right word. It was a feeling of fear mixed with a kind of existential dread, washing over me in waves, and then my heart was pounding, the walls were closing in, and I was gripped with an intense feeling of unreality. (This is something that people with panic disorder don’t often explain—or maybe it’s different for everyone. But for me the worst part of a panic attack is the
 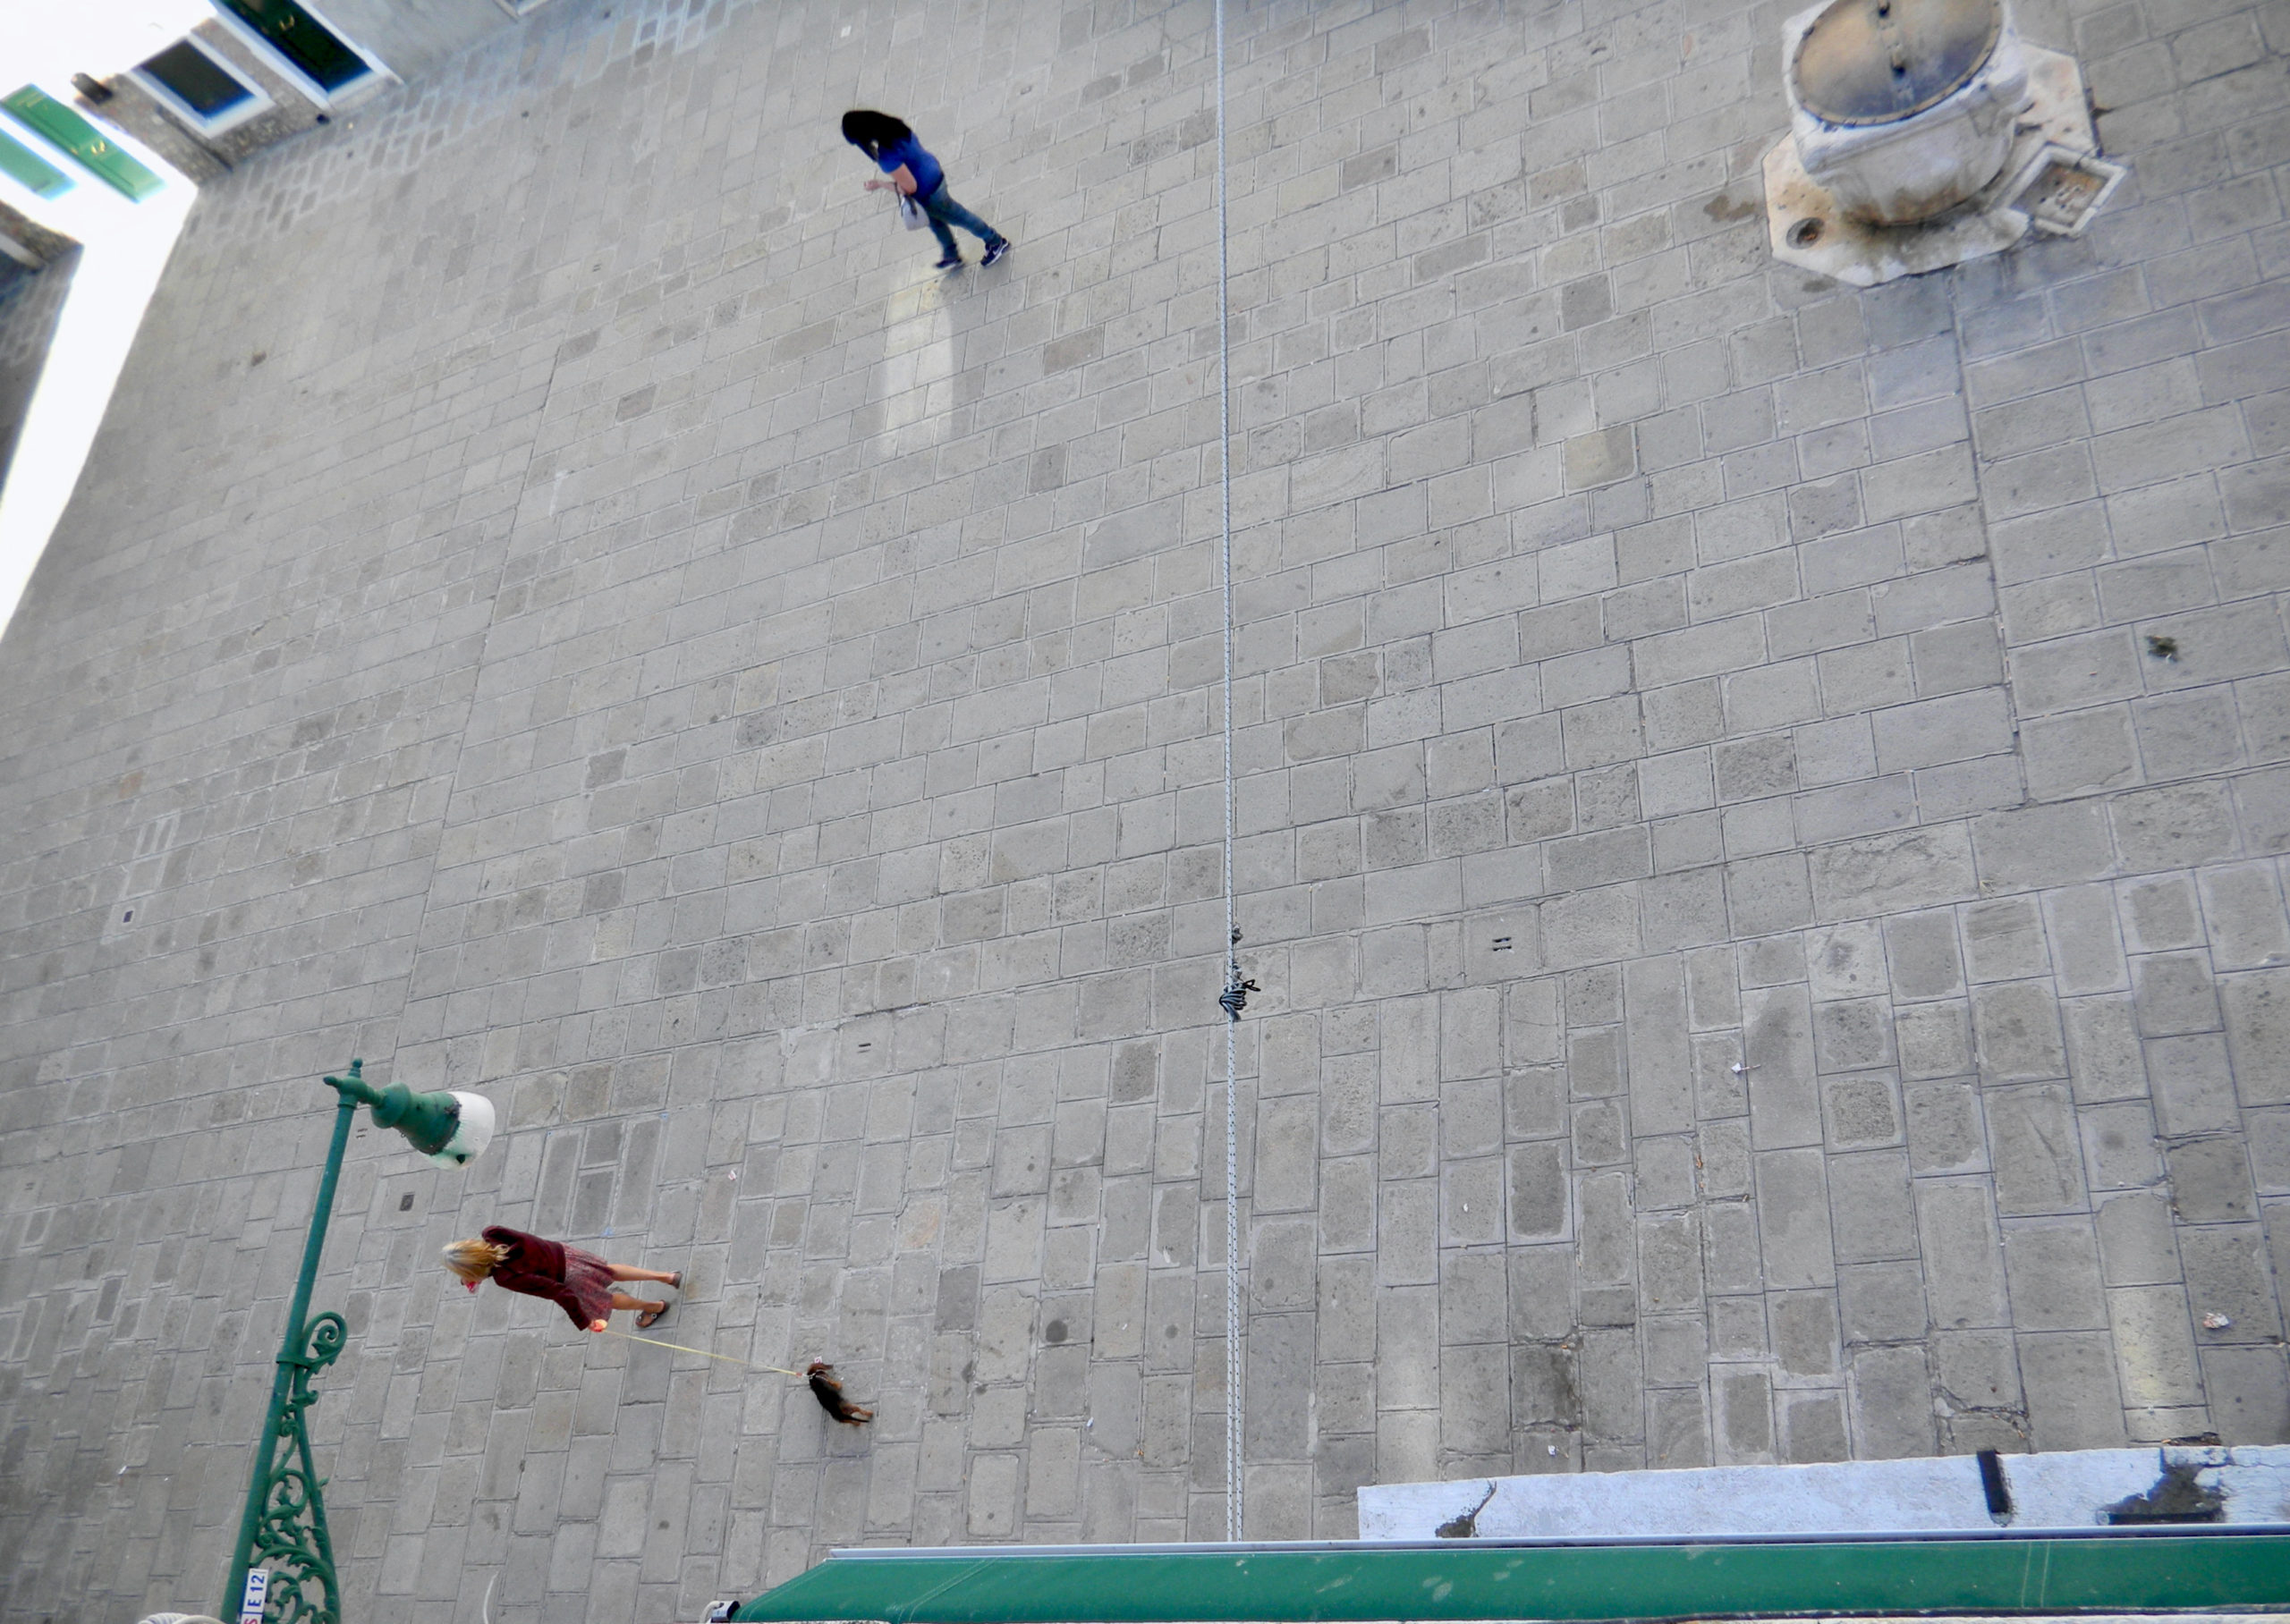 Sughra Raza. Another Morning. Venice, July 2012.
 We primates of the


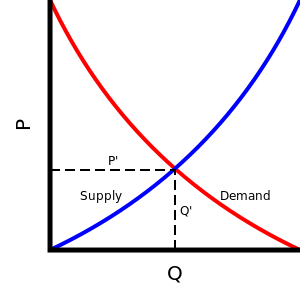 Every Econ 101 student learns the basic model of demand and supply. It’s pretty straight forward. Picture a graph with the price of a product or service on the vertical axis and the quantity supplied and demanded on the horizontal axis. There are two curves drawn on this graph: the demand curve and the supply curve. The demand curve is downward sloping because as prices decrease, consumers are willing to buy more. The supply curve is upward sloping because producers are willing to supply more when they are paid more. The “competitive equilibrium price” of the product or service is where supply equals demand: two curves intersect. When prices are higher than the equilibrium price, supply is greater than demand: there is “excess supply”. This makes sense: at higher prices, suppliers are going to be happy to sell more, but consumers aren’t willing to buy as much.