
by Hari Balasubramanian
 The slim, green book Natural History of Western Massachusetts is one of my favorites. Compressed into its hundred odd pages are articles and visuals that describe the essential natural features of the Amherst region, where I’ve lived since 2008. I turn to it every time something outdoors piques my interest — a new tree, bird or mammal, a geological feature.
One section that I particularly enjoy is the ‘Nature Calendar’ at the end. The calendar gives predictions on what to expect in each phase of a month; there’s approximately one prediction for every 3-day period. In early November, for example, it says “dandelions may still be blooming in protected areas”, and indeed some wildflowers do retain their bright colors despite freezing fall temperatures. It also says for the same month that “flocks of cedar-waxwings may be migrating through the region”. This was such a specific claim, but it is accurate: I was startled to see a flock of nearly a hundred waxwings swirling around bare trees on a rocky mountaintop this November.
The scientific analysis of such seasonal patterns is called phenology. Wikipedia defines it as “the study of periodic events in biological life cycles and how these are influenced by seasonal and interannual variations, as well as habitat factors (such as elevation)”. It’s a clunky, textbook kind of definition but the gist is clear enough. I find myself drawn to phenology for many reasons.
After thirteen years in Massachusetts, the seasons are familiar, yet each season there are always new details that capture my attention. One year I might realize how pine needles carpet the forest floor in the summer, creating a distinct soft texture on hiking trails; in another I might notice that only the chipmunks disappear in the winter while the squirrels stay active. The number of such details that I am yet to observe seems endless. They remind me that familiarity — and the boredom that appears to lurk beneath — are only mental constructs, that there is always something interesting to discover.
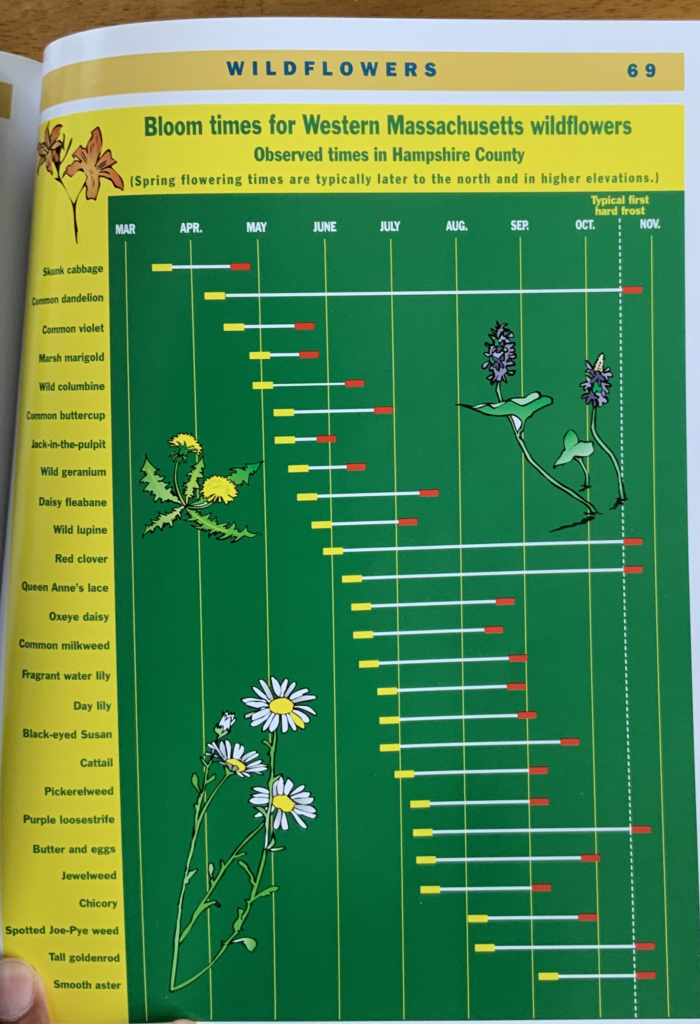
Phenology also excites the modeler in me looking for patterns in data. Take this graphic from the book that shows the bloom times of selected, well-known wildflowers in the region. It shows when a wildflower first appears in a year (call it arrival) and when it stops growing or disappears (call it departure). The time between arrival and departure is what we can call the wildflower’s sojourn time: the time it is actively blooming in the region. We see from the graphic that the skunk cabbage arrives mid-March and departs before May; smooth asters arrive in September and depart mid October; dandelions have the longest sojourn time, spanning three seasons. The schedule of wildflowers portrayed in this staggered manner reminded me of Gantt charts that I come across in my engineering research and teaching: graphs that show a timeline of, say, jobs scheduled in a factory, or surgeries scheduled in an operating room. Always satisfying to see how methods of analysis can generalize across totally unrelated fields.
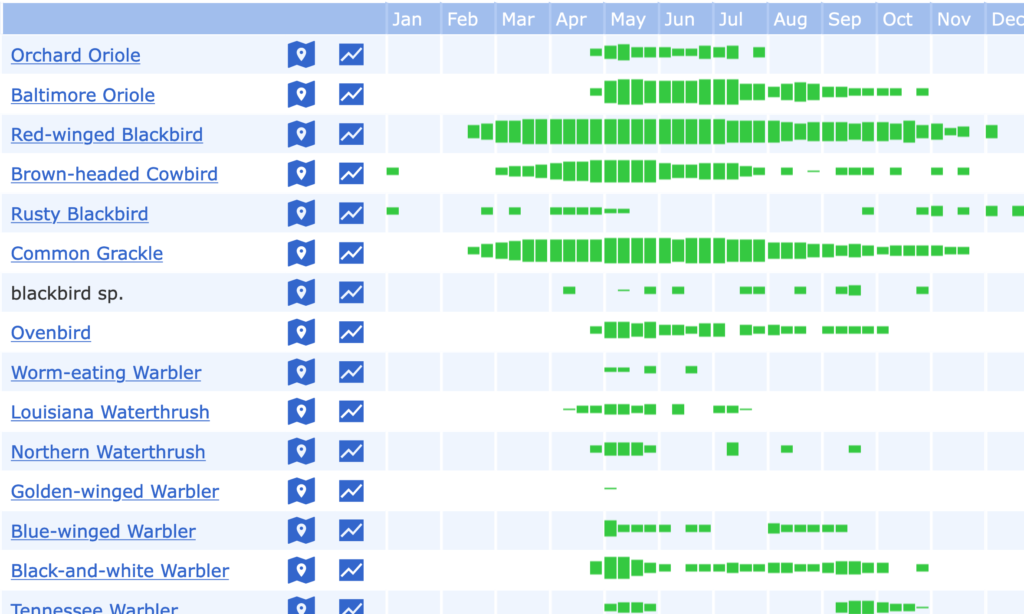
In fact, we could create a wildflower-like visual for any species whose presence or activity is seasonal. The website ebird does this for birds. Here’s a bar graph of when a selection of birds are observed in a conversation area near Amherst. The thicker the green bar, the more frequently the bird is observed that time of the year. Red-wing blackbirds and common grackles — which for me are harbingers of spring when they first show up in the wintry depths of February — have a longer sojourn compared to say the worm-eating warbler or the northern waterthrush.
We can go a little deeper. Returning to the wildflower image, let’s follow the vertical lines that mark the beginning of each month. We see that they cross some of the sojourn lines. This tells us how many and which exact wildflowers were active at the beginning of a month. Only one wildflower, the skunk cabbage — of the total of 26 in the list — is active at the beginning of April. In contrast, when August arrives half of the species in the list are simultaneously active. Merge the wildflower and bird datasets together, and we can now learn the combination of birds and wildflowers that are active at any time of the year. Imagine that we also know the phenology of insects, trees, amphibians, reptiles, and all other species, even microorganisms. With enough years of data across various habitats, elevations and latitudes (collected by groups such as the USA Phenology Network) we can hypothesize if there have been alterations in seasonal timing due to climate change or other causes.
But collecting such data on all species is not as straightforward. Because of their relative sizes — and aesthetic appeal to humans — wildflowers, plants, birds, amphibians, are more easily tracked. (There are complications even with rare birds, mammals and plants but let’s put that aside for a moment.) The ‘smaller’ organisms — insects and microbial life — play a critical role in ecosystems, but there are so many and such a great diversity of them that monitoring their annual patterns is tricky. Indeed, the lives of many insects and microorganisms are barely known to science, even if they have been given a Latin name, and there are thousands, perhaps even tens of thousands yet to be discovered.
Still, there are efforts underway to capture the so-called inventory of all species. Inventory — a jarring, business-like term for a catalogue of natural wonders, but it does convey the idea. Here are three examples of efforts to capture species inventories:
(1) The website iNaturalist allows naturalists (amateurs and experts) to upload their online observations, accompanied by images, creating a worldwide database of what species were found, when and where. In 2021, close to 29 million observations by naturalists resulted in 229,123 species being identified worldwide.
(2) The Vermont Atlas of Life (VAL) intends to create a “library of knowledge on Vermont’s animals, plants, fungi and microorganisms – an online, real-time resource with maps, photographs, and primary biodiversity data open for anyone to use.” Over 6 million records from the state have identified 12,500 species.
(3) The Earth Microbiome Project uses “DNA sequencing and mass spectrometry of crowd-sourced samples” to classify microbial life from various ecosystems around the world. In a 2018 paper, the founders of the project wrote that they had analyzed 27,751 samples from 43 countries, including samples from “bird eggshells, ants, bats, polluted marine sediments, and soil samples from deserts and Antarctica and North American permafrost.”
§
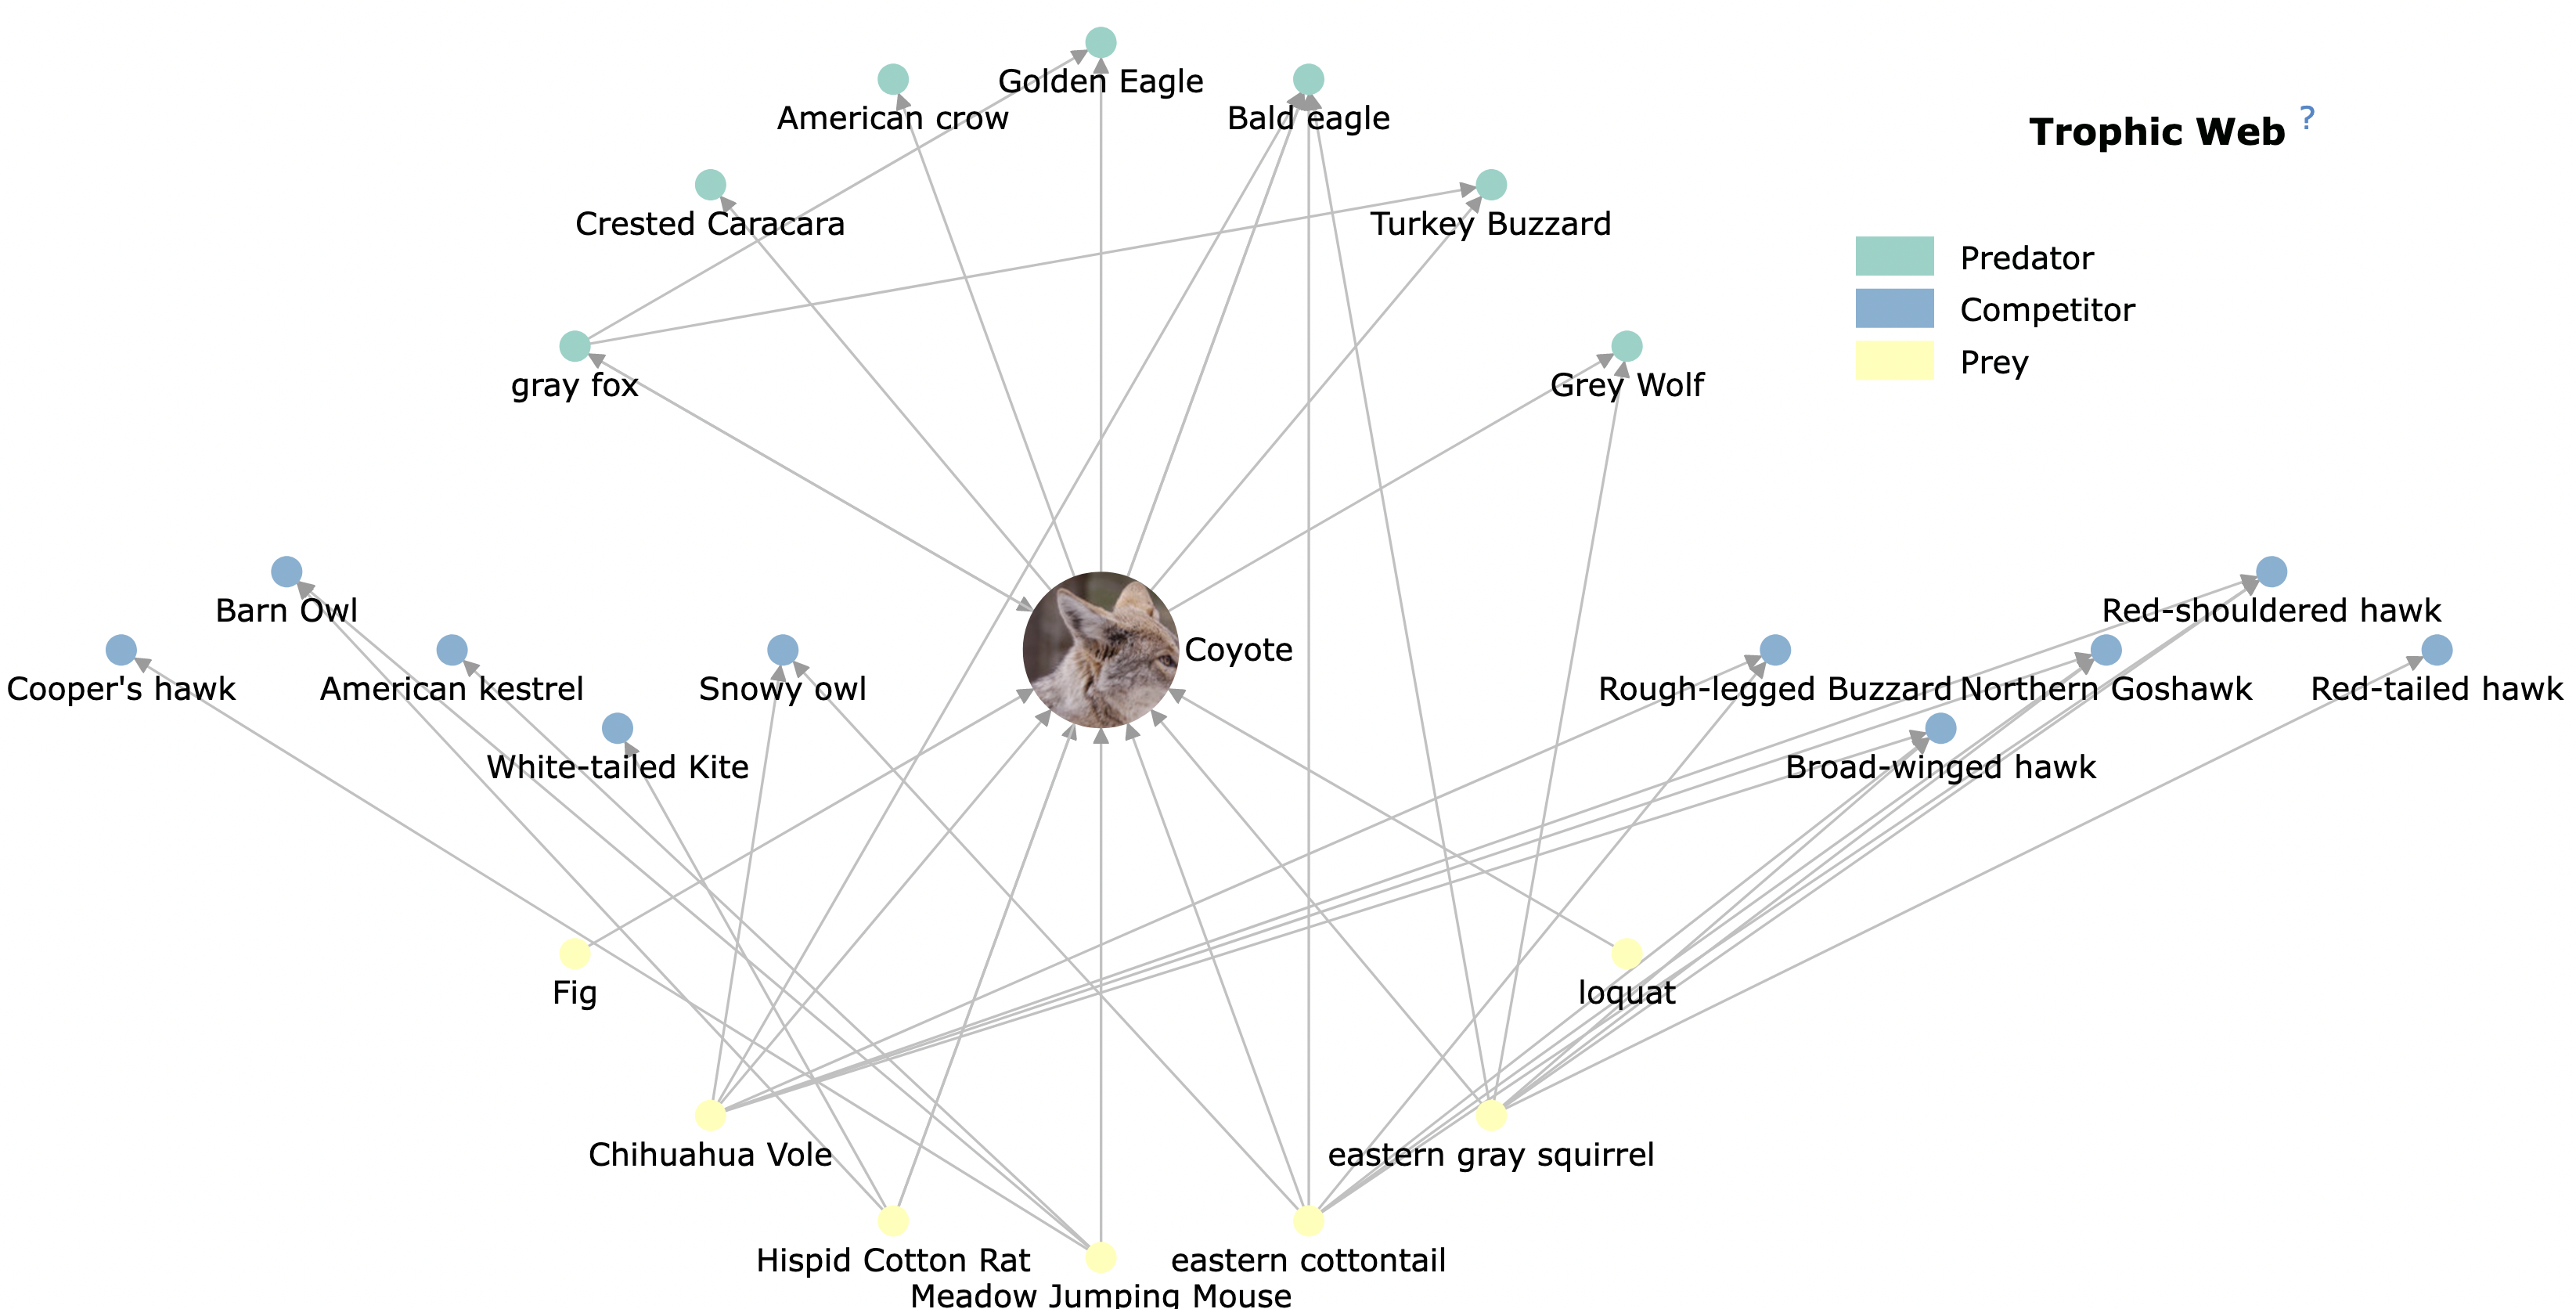
Figuring out what lives where and when is difficult enough. Even harder is understanding how species are linked to each other. For instance, the blooming of a wildflower might coincide with the life cycle of an insect that lives on it; and the insect may be consumed by a bird that builds a nest on a certain tree. The Encyclopedia Of Life has more intricate examples such as the one below in which the coyote (the focal species) is linked to a constellation of other species that are predators, prey or competitors. Such networks have been used to demonstrate the impact of keystone species — species that, if removed, have a cascading negative impact on the “abundance, diversity and distribution of other species sharing the ecosystem”. The earliest keystone examples include starfish in tidepools of the Pacific Northwest; sea otters in underwater kelp forests off the coast of the Aleutian islands; and more recently, wolves in Yellowstone National Park, though this last example is not as definitive as the others.
From what I can tell, discovering patterns in ecology is much harder than it is in other sciences. In engineering (which I am most familiar with), parameters of the process or system under study can be controlled — if not in real experiments, then at least somewhat reliably in computer simulations. Ecosystems, on the other hand, are notoriously messy and complex. Controlled experiments are often infeasible, and computer simulations can only analyze very stylized cases. Data collection is the hardest part, requiring countless hours of field and laboratory work, even if modern tracking devices and sensors are available. Think of the ornithologist at your local college, who has spent a lifetime studying woodpeckers in forests and is among a handful of people around the world who knows that piece of the ecological puzzle. Or someone like Adolph Murie who spent hundreds of hours studying the behavior of wolves in Alaska, changing our understanding of this apex predator. Or a forest ecologist like Suzanne Simard who has for decades studied how underground networks of trees, facilitated by fungi and roots, exchange nutrients across tree species.
So, from the relatively well understood phenology of wildflowers and birds, we’ve moved to the very frontier of ecology where much remains undiscovered. E.O. Wilson — the Harvard evolutionary biologist who recently passed away — has aptly called this frontier “the unknown webs of life”. In his 2016 book Half-Earth he writes: “so poor is our knowledge of the interactions that ecosystems studies remain an under-developed science”. Wilson emphasizes in particular the lack of studies of the ‘smaller’ species: “Let us ask of ecologists, over and again, how can we understand the deep principles of sustainability of a forest or a river if we still do not know even the identity of most of the insects, nematodes, and other small animals that run the finely tuned engines of the energy and materials cycles?” And this lack comes at a time when a large number of ecosystems are either being altered or disappearing worldwide. What will be the consequences of dismantling the unknown webs of life? Could there be a more important question in this age of the Anthropocene?
§
I’ve been drawn to these kinds of questions for some years now. There was a time when the sensory experience of being in nature was reward enough; I didn’t have to know the names of trees, or birds, or understand habitats. But living in Amherst — a small university town interspersed with forests, swamps and conservation areas — for more than a decade has slowly immersed me in the details: common names of species, their behaviors, where and when they can be spotted, how they relate to each other. In my academic engineering life, meanwhile, I’ve spent countless hours teaching mathematical concepts and finding patterns in datasets related to my research in healthcare systems. At some point — I think it was the early 2010s — I found myself wanting to apply the same quantitative lens to the myriad jigsaws of the natural world.
There is one problem, however — the small matter of not knowing even the basics of biology! Or geology, or entomology, or microbiology — all those fields that once seemed so uninteresting, but now seem so essential. I guess it’s never too late. There is some latitude in academia to go beyond one’s narrow specialization; maybe I will find someone with the necessary expertise to work with. Until then, I hope to write essays like this, if only to put my thoughts in order and learn what others with years or decades of experience in the field have discovered.