
by Jonathan Kujawa

One of the great pleasures in life is learning about something today that you couldn’t have imagined yesterday. The infinite richness of mathematics means I get to have this experience regularly. However much I think I know, it is a drop in the ocean of things yet to be learned.
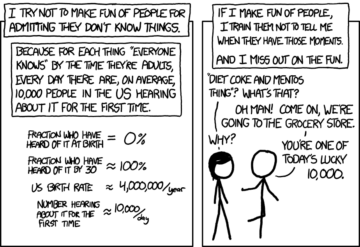
And even if lots of people already know something, it doesn’t matter when it’s new to you. As is often the case, xkcd made this point already. Even the most ordinary facts are amazing and new for the 10,000 or so people learning it today:
A few weeks ago I once again had the joy of learning about a previously hidden corner of the mathematical world: Gaussian Periods. Samantha Platt, a graduate student working with Ellen Eischen at the University of Oregon, gave a fantastic talk about Gaussian Periods in one of our seminars. Since a close second to learning something new is the fun of explaining it to someone else, I thought I’d take this opportunity to share Gaussian Periods with you.
We once again have to think about the complex numbers. From a branding point of view, they have a terrible name. The complex numbers are very handy, easy to work with, and show up in physics, math, computer science, computer graphics and CGI, and all sorts of other places. Once you get used to them, they aren’t much of a big deal.
For today, we just need to know that a complex number can always be written as a + b√-1, where a and b are real numbers. And given a pair of real numbers, we can always plot them as the dot (a,b) on the plane. So 2+3√-1 is plotted at (2,3), 0 – 6√-1 is plotted at (0,6), and so on. This connection to geometry hints at why complex numbers are used to make computer graphics.
On the other hand, this connection also means that math involving complex numbers can often be visualized in really interesting ways. We saw this last year when we plotted the roots of polynomials. If you include the complex roots and plot them in the plane, then you get beautiful fractal-like images.
Gaussian Periods are another example of this phenomenon.
First, we need the roots of unity. A root of unity is a complex number that if you multiply it by itself a sufficient number of times, you eventually get 1. For example, since (-1) x (-1) = (-1)² = 1, -1 is a root of unity. So is 1 since, for example, (1)³ = 1. If you only think about the real numbers, then 1 and -1 are the only roots of unity. However, the complex numbers have more. For example, consider 0 + 1√-1 = √-1. If we calculate, we get (√-1)² = -1, and so (√-1)4 = (-1)² = 1.
It turns out that the complex numbers have more roots of unity. Lots more. There is a complex number that if you multiply it by itself 2023 times, you don’t get 1, but if you multiply it 2024 times, you finally get 1. In fact, for any n = 1,2,3,4, …. there are complex numbers where if you multiply them by themselves n times, you get 1, but not before.
A Gaussian Period is the number you get by adding roots of unity. For example, -1 + 1, and 1 + √-1 could be Gaussian Periods. In 1796, Gauss was 19 years old and interested in constructing a 17-sided polygon using a compass and unmarked ruler. Years ago, we talked here at 3QD about the possibility of constructing numbers and geometric shapes with a compass and ruler (and here if you prefer to use origami).
Gauss showed the heptadecagon was constructible with a compass and straightedge as long as the number

is constructible. Gauss proved that that number is constructible by studying certain sums of roots of unity. These sums now show up in a wide range of places in mathematics. In his honor, these sums are now called Gaussian Periods.
Despite being used and studied for nearly 230 years, Gaussian Periods have only begun to reveal their secrets.
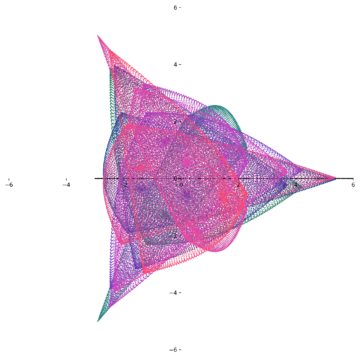
Ten years ago, another 19-year-old, Bob Lutz, had a thought: if you sum up complex numbers, you get a new complex number, and that complex number can be plotted on the plane. What if you plot large collections of Gaussian Periods?
The answer is startling:
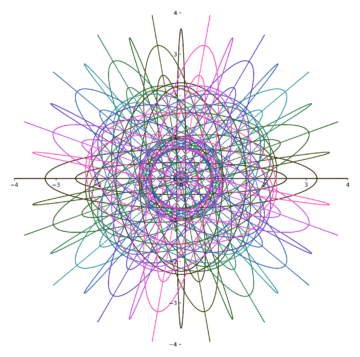
The only thing special about roots of unity is that they behave a certain way when you multiply them by themselves. Not knowing better, I would expect that if you add them, you’ll get more-or-less arbitrary complex numbers and, hence, arbitrary points in the plane. The most likely scenario for plotting Gaussian Periods is a meaningless cloud of dots in the plane.
It wasn’t until Bob Lutz tried it that this hidden beauty revealed itself [1]. Lutz also noticed that if you colored the dots according to certain rules, the resulting image became even more striking.
Mathematicians, of course, couldn’t help but wonder what was going on. In the last decade, there has been a burst of research centered on trying to understand the underlying rules that explain these amazing plots.
This brings us to Samantha Platt.
To draw them, you first calculate Gaussian Periods for k =1, 2, 3, …., n for some large number n. Ordinarily, people would plot all the periods at once to make an image. Another mathematician at the University of Oregon, Benjamin Young, was curious and wrote computer code to plot Gaussian Periods. By chance, he wrote his code so that it would plot the points one by one as they were calculated. Rather like the discovery of penicillin by Alexander Fleming, an accident of experimental circumstance revealed something surprising: Gaussian Periods don’t fall randomly on the plane; there is structure and dynamics to how they are plotted. Here is a video borrowed from Samantha Platt showing the dynamics of the Gaussian Period plots:
Samantha Platt’s PhD thesis investigates these dynamic features and gives insights into why and how they occur. She has intriguing results and told us about them in the seminar [2]. But I think she would agree that we have many more questions than answers at this point. The study of Gaussian Periods and related gadgets is a wide open field of research.
If you’d like to play with Gaussian Periods, I recommend you try this app by Ellen Eischen and Stephan Ramon Garcia. If you choose a few prime numbers to multiply together to get N, choose a few different prime numbers to multiply together to get omega, and fiddle with the colors and other options, you can make your own striking images.
It’s the mathematical equivalent of a Spirograph!
[1] In our defense, you have to plot hundreds or thousands of Gaussian Periods. Doing those sums and carefully plotting the results only became possible with the advent of computers.
[2] You can read her research paper here if you’d like to see the details.