
by Jonathan Kujawa
 In 2016, here and here at 3QD, we talked about some of the inherent paradoxes in democratic voting [1]. We discussed Arrow’s Impossibility Theorem, along with related results like the Gibbard-Satterthwaite Theorem. They tell us that there is no way to convert the individual preferences of the voters into a single group preference that doesn’t also conflict with some simple, commonsense guidelines that we can all agree are reasonable. Things like “No dictators.” And “If everyone prefers Candidate X to Candidate Y, then Candidate Y never beats Candidate X.”
Certainly, voters are sometimes irrationally motivated. I know of an otherwise reasonable mathematician who asked a colleague to vote on their behalf in a departmental chair election. Above all else, this mathematician did not want Faculty Member Z to be elected department chair. They gave their colleague two lists of all the eligible faculty in the department; each list was in a very carefully chosen order. The first list was ordered by the mathematician’s actual preference for who should be elected chair. This list was to be used only if Faculty Member Z wasn’t on the ballot. The second list was ordered according to the mathematician’s best 4D chess assessment of who was most likely to beat Faculty Member Z in a head-to-head election. That list would be used if Faculty Member Z was on the ballot. In the ideal election system, there should be no need for the second list. But strategic voting is very much a thing in elections.
You might assume such paradoxes are due to the vagaries of humanity. From what I can tell, most human minds are filled with a circus of chaos monkeys that are impossible to predict. Imagine describing the here and now to a 2016 version of yourself.
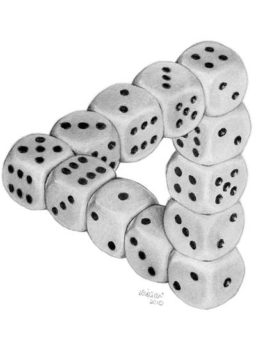
Imagine there are three dice. These dice are entirely ordinary except that they have an unusual numbering. First, the opposite faces of each die are the same number. This means there are only three different numbers used for each die. Second, let’s suppose that each of the numbers 1 through 9 are used on one of the dice. For example, maybe the first die uses 1, 5, 9; the second die uses 3, 4, 8; and the third die uses 2, 6, 7.
Let’s play a game with these dice. You can pick any die you like, I follow by picking a die from the two remaining dice, we roll, and whoever has the larger number wins. Surely, this is a fair game, right? After all, each number has an equally likely chance of showing up. I even let you pick first to ensure I’m not up to any shenanigans. Of course, my protests should only raise your suspicions.
Indeed, there is something funny going on with these dice. Around 1970, the statistician Bradley Efron discovered intransitive dice. The dice described above are an example of intransitive dice. They have the property that no matter which die you choose, I can always choose one of the other and guarantee myself the better odds. In this case, the first die is more likely to beat the second, the second is more likely to beat the third, and the third is more likely to be the first!
This is completely counterintuitive to me. I don’t know about you, but my instinct is that all three die should be equally likely to win. If somehow it was possible that different dice can have different odds, then surely it must be that one of the dice is better than the rest, right? Evidently not!
It reminded me of the paradoxes in voting. It turns out that it is entirely possible for a majority of voters to prefer Candidate A to Candidate B, a majority to prefer Candidate B to Candidate C, and a majority to prefer Candidate C to Candidate A.
After Efron discovered this paradoxical phenomenon, it was investigated by various folks. For example, you might hope that there is something special about the numbers 1 through 9. Drs. Schaefer and Schweig showed in their paper that this strange possibility is ubiquitous. They prove that for any n that is three or more, if you have three n-sided die, it is always possible to label the sides using the numbers 1 through 3n to make the dice intransitive. That is, you can number the dice so that Die A is more likely to roll a large number compared to Die B, Die B is more likely to roll a large number versus Die C, and Dice C is more likely to beat Die A [3]. Bizzare!
In fact, Schaefer and Schweig show even more. You can arrange the labels on the dice so that not only are the three dice intransitive, you also have that the odds of A beating B is exactly the same as the odds of B beating C and the odds of C beating A. Our example from above was borrowed from Schaefer and Schweig’s paper. There they show that the chance of A beating B is 5/9 ≈ 55.5%, but the chance of B beating C is also 5/9, and the chance of C beating A is also 5/9. Even more bizarre!
Thinking about three-sided dice reminded me of Matt Parker (of Stand-up Maths fame) and his quest to make a three-sided coin. The goal there was to figure out how thick a coin should be so that the odds of it landing heads up, heads down, or on its side should be 1/3, 1/3, and 1/3. Youtuber Sirrandalot followed up with a video where they did a wide variety of numeric simulations and found numerous subtle issues with designing a three-sided coin (turns out that “bounciness” is an important factor). This year the Belgian bank Vdk released a three sided Euro coin:

Gamblers beware! They make no guarantee that this is a fair coin.
This brings us full circle. Even if you have a fair coin where heads and tails each have a 50-50 chance, you might speculate that the human act of flipping could have some effect. More than a decade ago, Persi Diaconis, Susan Holmes, and Richard Montgomery calculated that the chance of a flipped coin showing the same face as the one it showed before flipping is approximately 51%. If the coin started heads up, it is slightly more likely to land heads up after the flip. You can read their paper here.
Lest you think this is a theoretical result that surely doesn’t hold up in reality, I point you to this article from October. A group of 48 people in 46 countries collectively flipped a coin 350,747 times and showed that indeed a coin ends where it starts 50.8% of the time.
[1] 2016 seems like a lifetime ago.
[2] The original image can be found here.
[3] Our original example is the case of n=3. Since in our example each die has two faces with the same number, it only has three different numbers and acts like a three-sided die.