
by Hari Balasubramanian
Something different this time — an article on one of my longstanding research themes.
Since 2015, as part of research that has involved many students, I’ve worked with a dataset called the Medical Expenditure Panel Survey (MEPS). The survey is conducted annually by the U.S. Agency for Healthcare Research and Quality (AHRQ). Thousands of households across the United States are sampled each year to represent the national demographic, and members of each household are compensated for their time spent completing lengthy questionnaires. It is tedious, painstaking work that involves many hours of interaction between the staff who conduct the survey and members of each household. Once completed, it takes years to carefully anonymize the data, organize it into different file types, and release it to the public. Which is why, as of today, the data files only go up to 2023; presumably, the 2024 files will be released next year. With all the cuts to programs at Health and Human Services (HHS), I wonder what the future of MEPS and other similarly important national surveys—like the CDC’s National Health and Nutrition Examination Survey (NHANES)—will be.
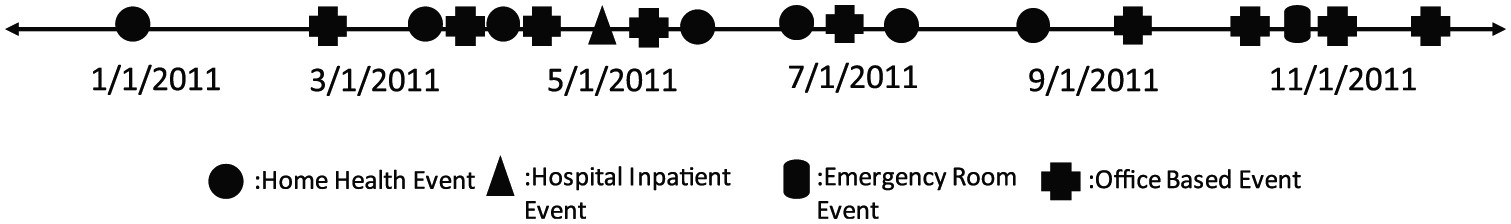
As the title suggests, MEPS focuses on healthcare expenses – whether out of pocket or paid by insurance. To track expenses, the survey records the medical events a person experiences in a year. The figure above, for instance, visualizes the timeline of medical events for a 69-year-old woman in 2011. The timeline is interspersed with home health and office-based events, with one hospitalization in May 2011 and an emergency room (ER) visit in November. Home health events refer to care received at home; office-based events refer to typical doctor’s appointments: seeing a family physician, a cardiologist, an endocrinologist, a neurologist, a dermatologist, and so on. Each medical event also has diagnosis codes, so the underlying disease(s) (a viral infection, diabetes, osteoarthritis, breast cancer) someone had in the year of the survey can be inferred. And by using the prescribed medicines file – by far the largest file download on MEPS – you can even know the precise set of medications someone was taking that year.
This is what I mean when I said the survey was tedious and painstaking work: imagine how many questions must be asked and answered to gather all these medical—and very personal—details. The upside is that anyone with the patience to go through the documentation can use MEPS to construct a detailed portrait of the types of health conditions, medical events, and expenses in the country. A quick Google Scholar search reveals that over 500,000 studies have used MEPS since the survey started in 1996, on topics ranging from “national trends in aspirin use” to “Medicaid expansion and opioid use” to the relationship between “precarious employment and mental health”.
§
I’ve also used MEPS for different research questions, and data extracts from the survey are often part of computational assignments in my probability courses. In recent years, however, I’ve focused on patterns in multimorbidity, an intimidating clinical term that refers to the presence of two or more chronic diseases in an individual. Multimorbidity rates have been rising globally. In 2017, researchers at the RAND Corporation estimated that 58% of the US population is apparently healthy or has just one chronic condition, but the remaining 42% have two or more chronic conditions.
That’s over 130 million Americans – an astonishingly high number! But given the advances in medicine, maybe we shouldn’t be so surprised. Multimorbidity can be attributed to the increased life expectancy we’ve enjoyed since the 1950s: the longer we live, the more diseases we can expect to have. And with the widespread availability of diagnostics – blood tests that evaluate dozens of biomarkers, MRIs, CT scans, X-rays, and, more recently, the surge in wearable devices that constantly monitor our vital signs – there’s a good chance that a “hidden” condition will be detected. Some would argue, perhaps correctly, that we are surrounded by a massive Medical-Pharmaceutical complex, whose financial interests drive the early detection of diseases. All it takes is for two biomarkers to be out of range, and you are on your way to multimorbidity. I’ve found this to be true for myself: my cholesterol levels are often above or below the recommended cutoffs, and my thyroid-stimulating hormone is always above the normal range.
In the last few decades, we’ve also witnessed profound societal changes: how the food we eat is grown, transported, and processed to ensure a longer shelf-life and instantly satisfy our cravings; how much more glued we are to our devices and social media and therefore more sedentary; and the rise in environmental pollutants, from pesticides in the water to microplastics just about everywhere. Some of these changes have noticeably impacted our health. The uptick in anxiety and depression among adolescents since the 2010s – the subject of Jonathan Haidt’s book The Anxious Generation – is one example. The increased prevalence of Type 2 Diabetes is possibly the clearest marker of these broader global trends. Although known and diagnosed in many ancient cultures (including ancient Egypt, Greece, and India) and long considered a disease of the wealthy, in recent decades its incidence has gone up around the world. And because diabetes impacts a host of other organs (the heart, the kidneys, the eyes), it is very much a gateway to multimorbidity.
§
In MEPS, multimorbidity can be inferred by analyzing the diagnosis codes that an individual collects over the course of the year they are surveyed. This takes us back to the timeline of medical events, which we saw in the figure earlier. By putting together diagnosis codes related to medical events, we can create a list of conditions for that year — what I will call an individual’s disease combination. (One caveat is that we do not know anything about how long these conditions were present, nor do we know anything about whether they were resolved in the following years.)
I was quite struck by the startling diversity of disease combinations among the surveyed individuals. Here, for example, are the disease combinations for three individuals from the survey. Each disease name is separated by a semicolon. Some disease names in the list may sound familiar, while others may sound strange — Lipid Metabolism Disorders, for instance, is the fancy medical term for abnormal cholesterol levels — but for our purposes here, the specifics are not essential.
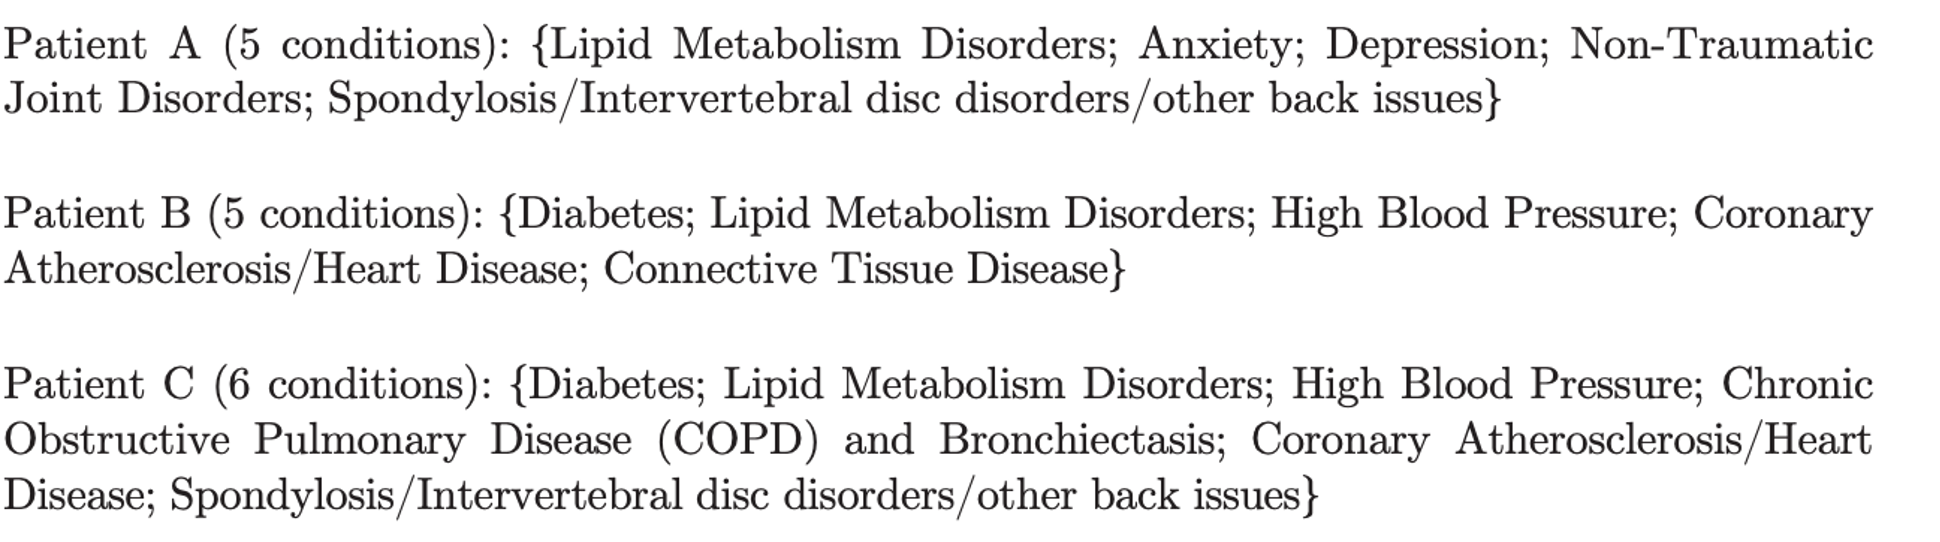
The broader point is that while the three individuals share subsets of diseases – in fact, the last two have four diseases in common – no two of them share the same combination. This feature, where someone’s list of diseases becomes their unique signature, is a matter of combinatorics. Since there are hundreds of diseases, the specific list of five that one person has in a year is unlikely to match exactly with the five that someone else has. In fact, among those surveyed in MEPS from 2016-19 that had 2-7 chronic conditions, we found a remarkable 34,880 unique disease combinations! There’s a fascinating paradox here: each disease combination is quite rare (observed in only a few or, more commonly, in just one person), but there are so very many of them that their combined prevalence in the population is high (~60 million individuals in the US have four or more conditions). A 2013 paper, among the best on the topic, aptly called this paradox “the high prevalence of low prevalence chronic disease combinations”.
§
How can we identify meaningful patterns in what appears to be a chaotic jumble of disease combinations? This question has captivated me for many years, and I’ve turned to a variety of machine learning techniques. One approach I’ve considered is simply counting the most frequently occurring subsets of diseases, often called frequent pattern discovery. For example, anxiety and depression often occur together, making them a frequent dyad (or pair), while the most common triad is high cholesterol, high blood pressure, and diabetes. Such subsets provide clues to epidemiologists, since there might be as-yet-undiscovered physiological mechanisms that explain why the diseases co-occur.
It gets difficult to list quartets and quintets (subsets of four or five), since there are literally hundreds of them. But here’s one visualization, based on MEPS 2019 data. In the middle column, selected quartets and quintets of diseases that co-occur frequently are shown. Each disease is indicated with a number. It would be impossible to list the names of diseases; the figure would get too unwieldy and perhaps unreadable. The right column contains the frequency — that is, the number of individuals in the MEPS 2019 dataset who shared the subset.
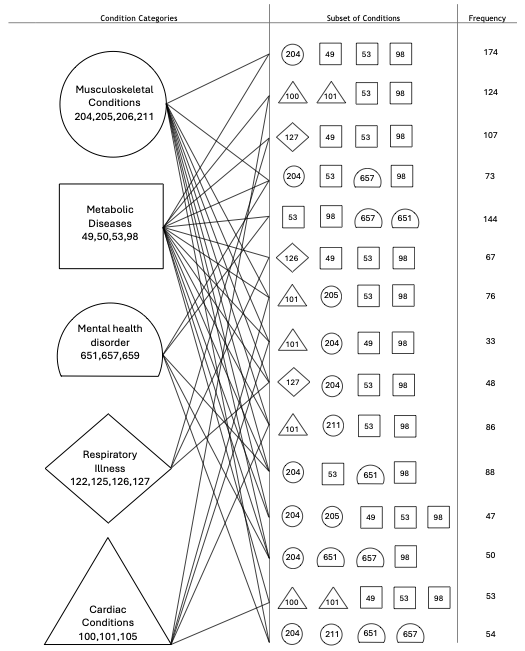
Take the very first quartet listed: [49,53,98,204]. This refers to [Diabetes, High Cholesterol, High Blood Pressure, Joint Disorders], and the column to the right indicates that 174 of the 28,512 individuals surveyed in MEPS 2019 share this precise subset of four diseases. This is the most frequent quartet in the United States. The column to the left gives us a sense of the body and organ systems to which the diseases belong. Each body system is indicated with a different shape: a circle, a square, a half-circle, and so on. Diabetes, High Cholesterol, and High Blood Pressure are metabolic diseases in this classification and are indicated using squares, while Joint Disorders is a musculoskeletal disease and is indicated with a circle.
Generally speaking, the most prevalent quartets and quintets in the United States are mixtures of diseases from five different body systems: musculoskeletal, metabolic, respiratory, mental health, and cardiac. All the subsets shown contain diseases that belong to at least two different systems. Some, such as [204, 53, 657, 98] or [Joint Disorders, High Cholesterol, Depression, High Blood Pressure], which were present in 73 of the surveyed individuals, contain diseases from three different systems: musculoskeletal, metabolic, and mental health.
Of course, we haven’t yet discussed how a host of other issues – age, gender, genetics, socioeconomic factors, geography, nutrition, physical activity, prior medications, treatments – may impact these conditions, but you could do the same analysis while trying to control for these other factors. Age, gender, and socioeconomic factors can be controlled for in MEPS, but you would need other datasets, like the National Health and Nutrition Examination Survey (NHANES), to account for physical activity and nutrition.
§
Multimorbidity poses challenges for both patients and physicians. Because medicine is so subdivided into specialties, someone with multiple conditions ends up seeing a constellation of specialists: a cardiologist, an ophthalmologist, a neurologist, a psychiatrist, a gastroenterologist, a family physician, and so on and so forth. I noticed in MEPS that it is not uncommon to have dozens of doctor’s office visits in a single year, spread across 6-10 different specialties. Imagine scheduling all the appointments, arranging transportation, keeping track of the medications, filling out countless and repetitive forms, and going through the same tests again and again. I suppose this is the price we pay for the explosion of medical knowledge and our relentless search for longevity. For a physician, perhaps the most disconcerting aspect is advising a patient on a disease combination they’ve never encountered before, and not knowing how a medication or treatment typically prescribed for one disease might impact others.
On a positive note, our evolving understanding of how diseases from seemingly disparate body systems relate to each other is also re-integrating the silos of medicine, leading us to a more holistic view. For instance, we now take it for granted that diabetes, obesity, high blood pressure, and heart disease are closely connected, and that physical activity and diet play an important role in the epidemiology of these diseases. These facts are now part of the cultural zeitgeist and compel us to examine our food and activity choices. Yet, the link between, say, diabetes, high blood pressure, and heart disease is surprisingly recent and was not definitively established until the mid to late 20th century. It took studies that follow large cohorts of individuals across many decades or even generations – the Framingham Heart Study, the Seven Countries Heart Study, and the Nurses’ Health Study – to slowly piece it all together.
There are plenty of other recent discoveries that link seemingly unrelated conditions: mental health with the health of the gut microbiome; infection with the Epstein-Barr virus with the later development of multiple sclerosis; and the benefits that a vaccine for shingles may provide in preventing dementia.
All this has made me wonder: Could similar clues be hiding in the thousands of disease combinations I’ve been studying for so long in MEPS? Or, if we look again at long-term cohort studies that span decades, could we find patterns that medicine has not detected yet, but are clinically valid? Are there algorithms that can parse through a large and complicated medical dataset, not to predict an outcome (the most common type of machine learning algorithm), but to create a database of interesting correlations and patterns, especially rare and unusual ones that show up only in a small number of individuals?
There do seem to be algorithms out there suited for such discoveries. In the data mining literature, they come under the broad areas of association rule mining and the oddly named bump hunting. In fact, my own search for the most frequent subsets of diseases is a special case – the simplest application – of these approaches.
I could go on to describe the algorithms, but that would be too technical. I wrote this essay to put my own thoughts on multimorbidity together and give readers a flavor of its context and complexity. Maybe this will be the first of many essays to come!
References and Acknowledgements
1. The first figure — visualization of the timeline of events for a 69-year-old woman — is from a 2018 paper in the journal Medical Decision Making: Policy and Practice. The second figure is from a tutorial I published last year.
2. Many students have been involved in this research over the years. I would like to acknowledge Gabriel Schmitt, Joshua Gladstone, Arjun Mohan, Pracheta Amaranath, Ali Jafari, and Sindhoora Prakash for their contributions.
***
Enjoying the content on 3QD? Help keep us going by donating now.