by Hari Balasubramanian
Ecology is quite distant from my academic work in engineering, but I’ve developed a great love for it in recent years. To learn the basics, I’ve tried many books and articles, but I often turn to the college-level biology textbook Principles of Life. Like many academic texts, this one is not suited for cover-to-cover reading – at over 1000 pages, it is too heavy even to hold comfortably! Still, every time I’ve flipped through its pages, there’s been something interesting to reflect on.
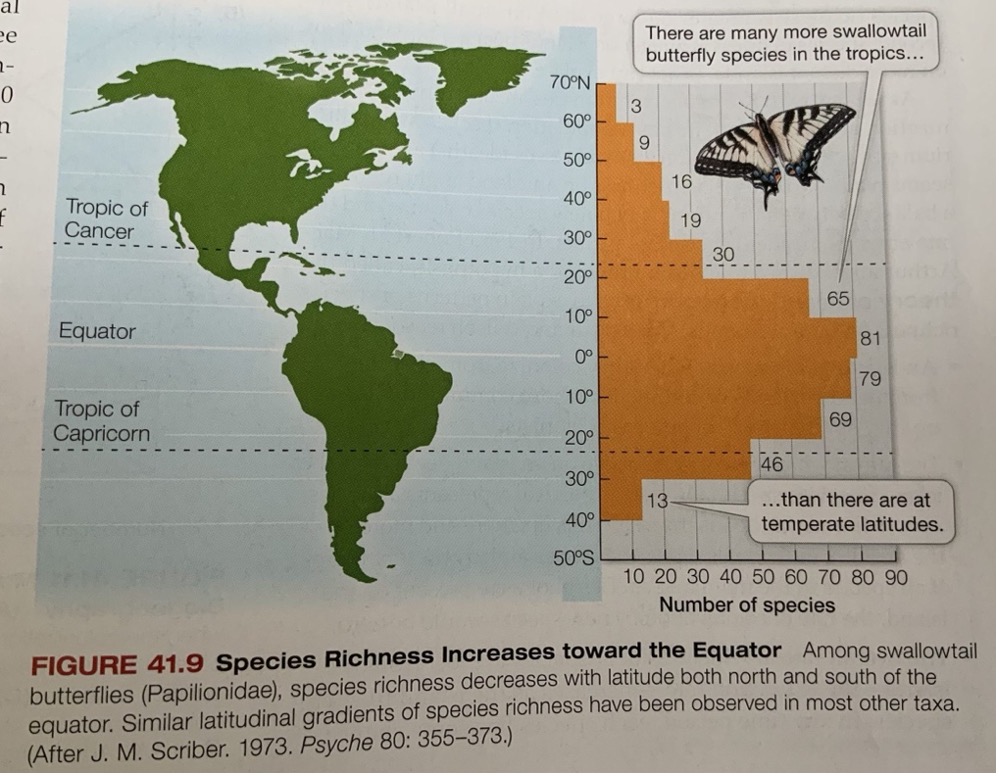
My favorite figure (below) is from the book’s ecology section, and it leads us to the biodiversity theme of this essay. The biological diversity of a region can be quantified in many ways. One intuitive measure is the number of distinct species of a taxonomic group in the region — for instance, the number of species of birds, mammals, or primates found there.

The bar graph on the right shows how the number of butterfly species in the swallowtail family (x-axis) varies by latitude in the Americas (y-axis). In the formal taxonomic system, the family is called Papilionidae and it contains over 550 species. The graph tells us that the number of swallowtail species in the Americas – and hence swallowtail diversity – increases as we move from the higher latitudes in the north and south toward the equator, where it peaks. It’s fascinating that the species count distribution follows a bell curve centered around the equator, but it’s skewed towards the north, perhaps because North America contains more land area.
If we analyzed the global distribution of all known ant species (about 14,000 so far) and all known beetle species (an incredible 400,000 described so far and counting!) are found in the world, we would observe a similar bell curve: most species would be concentrated in the tropics, and counts would taper off towards the poles. In the 1970s, the entomologist Terry Erwin found over a thousand species of beetles in a sample of just 19 trees in a tropical forest in Panama. (Erwin fogged the canopy with biodegradable insecticide and collected dead bugs that fell from the high reaches of the tree into a net below – cruel, but that’s how scientists do their work sometimes.)
Since latitude influences species counts, this ecological pattern is called the latitudinal species gradient. The gradient is not limited to insects. With a few exceptions — conifers, salamanders, and lichen which show the opposite gradient (increasing diversity moving toward the poles) — it shows up in most other groupings of species (taxa) as well: marine invertebrates, vertebrates, plants, and animals. Consider the case of birds. About 400 species of birds have been identified in New England. In Florida, that number goes up to 538. Farther south, in Costa Rica, the number jumps to 948. And in Colombia, not far from the equator, the tally stands at 1907.
Among trees, the gradient is even more dramatic. A single hectare in Yasuni National Park in Ecuador – often considered the most bio-diverse place on earth – contains 655 tree species. In the entire 50-hectare Yasuni site managed by ForestGEO (a Smithsonian Institution-led consortium that studies forest plots around the world), a total of 1,150 species of trees have been identified. Compare that with the 800-900 tree species in the United States. How amazing is that: the number of tree species across a range of habitats – from the rainforests of the Pacific Northwest to the temperate forests of New England, to the mangrove swamps of Florida – is matched by a few dozen hectares in tropical forests!
The trend holds in marine environments, too: Coral reefs, most of which are found in tropical and subtropical waters, have some of the densest concentrations of species. They are aptly called the “rainforests of the sea.”
Causes and Nuances
What is so special about the tropics – why do they have such exceptional diversity? This has been a hard question for ecologists to answer definitively. But there are a few working explanations. Abundant and steady sunlight and rainfall in the tropics are obvious candidates. Less obvious is the point that the tropics have had more stable climates since the asteroid strike 66 million years ago which famously ended the reign of the non-avian dinosaurs. Stability over millions of years allows greater evolutionary diversification. In contrast, the higher latitudes have been subjected to eight glacial cycles – ice ages – in the last 740,000 years. The most recent of these ice ages ended 10,000 years ago when the glaciers that covered large parts of North America receded. (Somewhat startling to contemplate that the forests of New England, where I spend a lot of my free time now, didn’t even exist then!) Ice ages naturally lead to extinctions and constant adjustment of geographic ranges for species, resulting in less stable conditions for biodiversity. Many other explanations – seasonality, aridity, the physical structure of habitats, competition among species, to list just a handful – have been hypothesized, which are too long to get into here.
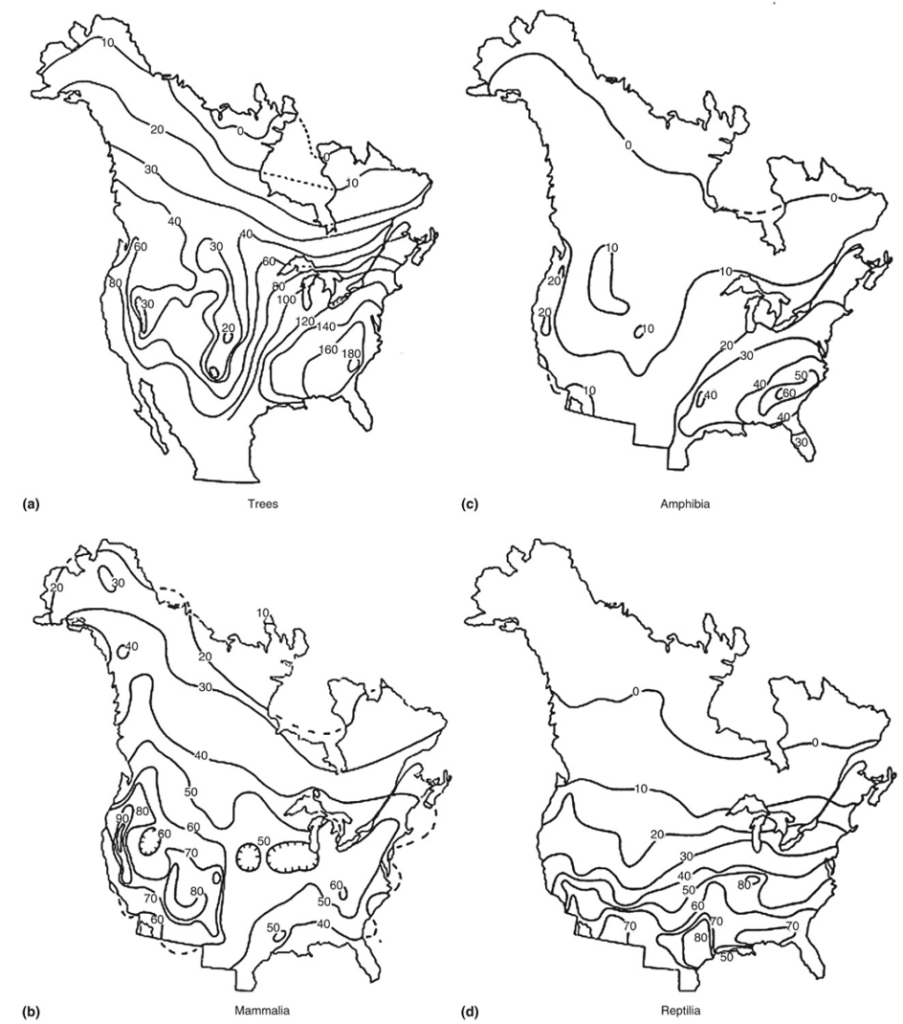
Some of the best work on explaining biodiversity patterns comes from David Currie, of the University of Ottawa. In his 1991 paper, Currie provides contour maps that divide Canada and the USA into 336 quadrats (each quadrat is a small parcel of land, typically rectangular) and overlay species counts for trees, amphibians, mammals, and reptiles on each quadrat. Contours in the map connect regions that have (approximately) the same number of species.

Broadly speaking, the latitudinal gradient does indeed hold in all four contour maps. But the contours can be quite wobbly, suggesting there are other factors at work. The number of tree species in the Pacific Northwest (60), for instance, is double that of the number in the American Southwest (30), even though the former is at a higher latitude. That’s not surprising – the Pacific Northwest gets a lot more rainfall, and the Southwest is famous for its starkly arid landscapes. What’s more interesting is that more trees don’t necessarily mean more reptiles: there are more reptiles in the Southwestern deserts than in the Northwest. Currie found using statistical models that include 21 environmental variables in each of the quadrats that warm, humid environments support more species of trees, while hotter places, even if not humid, favor mammals, birds, reptiles, and amphibians.
So, the biodiversity picture that emerges from Currie’s analysis is quite nuanced, even if the gradient generally aligns with expectations.
Another piece of the puzzle is how changes in elevation affect biodiversity. This pattern is called the elevational diversity gradient. Anyone who has traveled – either by car or a strenuous hike – from the base of a mountain range to a peak that is over 10,000 feet, would have noticed this gradient. There is often evidence of a “diversity bulge” in the middle elevations, but as you go higher, biodiversity decreases: trees disappear after a certain point and there’s a noticeable drop in all types of plants. Higher altitudes in the tropics, however, will still have higher diversity than the same altitudes farther north or south — for instance, at a given elevation, a mountain in Borneo is likely to be more biodiverse than a mountain in Alaska or one in South Africa.
Biodiversity Hotspots
The geographic variation of biodiversity might seem like an interesting curiosity. But it also has implications for conservation: how, in a time of mass extinction, the Earth’s millions of species, spanning different phyla and kingdoms and inhabiting a range of ecosystems, should be protected. Conservation is not only a matter of being “kind” to other species or enjoying the aesthetic pleasures of nature, though that would be motivation enough. The webs of life that link species together in ecosystems – from micro-organisms to plants to apex predators – give us a range of benefits called “ecosystem services”. Pollination, the natural purification of water, clean air, and the recycling of soil nutrients are just a few examples. With ecosystems disappearing or being altered so quickly worldwide, the services that we’ve long taken for granted are now under threat.
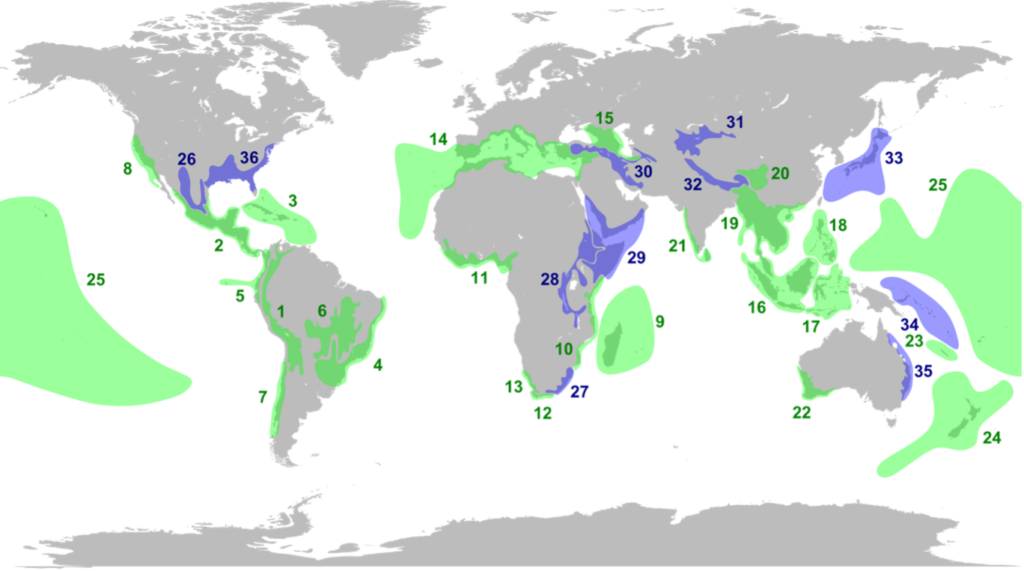
In the 1980s and 1990s, the British environmentalist Norman Myers and his colleagues in Conservation International published several studies, culminating in a highly influential paper in the journal Nature. The paper’s central premise is that conservationists cannot protect all species because extinctions are proceeding too fast and there are constraints on resources and funding. Conservation efforts, therefore, must be triaged: they must be prioritized in parts of the world with the greatest needs. Myers and his team looked at regions around the world and for each region, they compiled the number of endemic plant and vertebrate species (species found nowhere else in the world). They also compiled the losses in habitat experienced by each region and the percentage that was protected. Regions that had the highest number of endemic species and had suffered the most significant habitat losses were called biodiversity hotspots. The paper argues that conservation efforts must be prioritized in these hotspots.

The originally proposed 25 hotspots are shown in green on the map; 11 blue hotspots were added later as the concept was refined (further details are here). Thanks to the latitudinal species gradient, the tropics are strongly represented. One hotspot (not as prominent on the map) is the thin mountainous strip that runs along India’s southwestern coast, called the Western Ghats. The southern end of the Ghats is not far from my uncle’s farm in Tamil Nadu. All of Central America is also a hotspot. During my travels in Costa Rica, I often heard naturalist guides proudly claim that their country covers a mere 0.03% of the Earth’s area but hosts an outsize 5% of the total species on Earth. And all of island-rich Southeast Asia is a hotspot, with Indonesia featuring prominently (though I am surprised why Papua New Guinea is not included – perhaps data was lacking).
The hotspots concept has been quite popular and has mobilized a great deal of funding from conversation organizations. I like how it summarizes global biodiversity patterns; I am also struck by the amount of work that must have gone into tallying endemic species in all parts of the world: the foundational work that enabled Myers and his team to compile their data.
But there are shortcomings too. Because Myers’s study relies largely on counts of endemic species, ecosystems that are vital in other ways do not make the list. The iconic Serengeti – the semi-arid grasslands in East Africa, home to a breathtaking diversity of large mammals: zebras, giraffes, wildebeests, gazelles, elephants, lions, cheetahs, hyenas – is not a hotspot, simply because it does not contain enough endemic plant and vertebrate species to make the threshold. Similarly, the Arctic wilderness, which spans Canada, Greenland, Alaska, and Siberia, has a low count of endemic plant species but contains large quantities of permafrost: soil that has remained frozen for hundreds of thousands of years. Permafrost contains millennia-old remains of dead organisms (including megafauna like mammoths) that microbes have not fully decomposed due to sub-zero temperatures. This makes it a vast natural storehouse of carbon. As the permafrost melts due to increased global temperatures and the biomass decays, the stored carbon dioxide and methane will be released into the atmosphere, accelerating warming. Thus, while the Arctic wilderness is not a biodiversity hotspot, it plays a critical ecological role. Other parts of the world — grasslands, mangrove forests, salt marshes — may be similarly excluded even if they provide valuable services.
These examples suggest that the concept of biological value — quantifying why an ecosystem is important — needs to include many more dimensions than the raw counts of endemic species and habitat losses. In the final analysis, the Earth system is the sum total of all its ecosystems and living organisms. It’s only in the last century that scientists have begun piecing together the complicated pathways through which energy and matter (water, nutrients, and elements such as nitrogen, carbon, and phosphorous) flow between biotic (living) and abiotic (physical and chemical) components of our planet. Biodiversity is a vital feature and consequence of these pathways, but not the only one.
§
Much of this meandering essay grew from my reading – I’ve mentioned several articles throughout. However, E.O. Wilson’s dense but strangely beautiful The Diversity of Life was the biggest influence. The essay also developed from the many hours I spent trails in and around Amherst, Massachusetts: I would become curious about, say, a lichen, a moth, or a bird, and that would prompt me to look them up. Mary Holland’s Naturally Curious has filled many pieces of the New England biodiversity puzzle for me.
An urge to experience tropical diversity firsthand took me to the La Selva and Las Cruces research stations in the rainforests of Costa Rica, where biologists from around the world converge to do fieldwork and collect data for their projects. The projects ranged from studying stingless bees to understanding how nitrogen-fixing bacteria worked in the soil, to how hummingbirds pollinated flowers. I found the emphasis on fieldwork in the rainforest quite attractive, a welcome contrast to abstract mathematical models and algorithms that my academic specialty (operations research) demands.
Finally, and somewhat surprisingly, natural history museums, which never interested me earlier, have now turned into sources of great inspiration. Especially the Smithsonian Museum of National History in Washington DC and the Beneski Museum of Natural History in Amherst, Massachusetts: I can’t remember the number of times I’ve felt goosebumps or a sense of wonder when reflecting on their exhibits.
***
Enjoying the content on 3QD? Help keep us going by donating now.
