
by Jeroen Bouterse
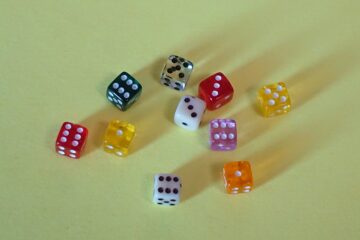 “You are aware”, I ask a pair of students celebrating their fourth successful die roll in a row, “that you are ruining this experiment?” They laugh obligingly. In four pairs, a small group of students is spending a few minutes rolling dice, awarding themselves 12 euros for every 5 or 6 and ‘losing’ 3 euros for every other outcome. I’m trying to set them up for the concept of expected value, first reminding them how to calculate their average winnings over several rounds, and then moving on to show how we calculate the expected average without recourse to experiment. It would be nice, of course, for their experimental average to be recognizably close to this number. Not least since this particular lesson is being observed by the Berlin board of education, and the outcome will determine whether or not I can get a teaching permit as a foreigner.
In case they are reading this, I would like to emphasize that I plan all my lessons with care and forethought; but for this particular one, you can bet I prepared especially well and left nothing to chance. Except for the part I left to chance, that is. To be precise: I had neglected to calculate in advance how likely it was for the experimental average over roughly 80 games to diverge from the expected value by a potentially confusing amount. I relied on my intuition, which informed me that 80 is a large number.
Turns out it’s not that large after all. The probability of at least 50 cents divergence (which would bring the experimental average at least as close to another integer as to the expected value of 2 euros) is, I have now figured out, a whopping 56%. There was only a 0.6% chance for the experimental average to exceed, as it did, 4 euros, but I had also implicitly accepted a 4% chance that the results would have been closest to 0 or even negative. Just imagine the damage that would have caused.
It would not have been the first time for a probability experiment to result in my pleading with my students to trust the math over actual results they have just seen with their own eyes. The Monty Hall problem has been especially awkward at times. At first sight, the famous (initially) counterintuitive situation begs for enactment in a classroom situation. A contestant selects one out of three doors, one of which holds a prize. The host then eliminates a different door guaranteed not to hold the prize, and the contestant is given the choice either to open the door they picked, or switch to the remaining one. The switchers win two in three times, the stayers only one in three.
Of course, things that have a one in three chance of happening happen a lot. I preface these experiments with extensive disclaimers about making the right decision but just being unlucky, but it still bothers me when, under my watch, bad things happen to rational people. Worse still, over the years I have been host to several occasions where a majority of stayers found the treasure while a majority of switchers uncovered a goat or whatever other cartoon animal I had whimsically stuck behind the virtual door.
In a 1985 article, statistics educators Schuyler Huck, Sheldon Clark and Gipsie Ranney already explained what I have gradually come to realize over the last decade: that as a math teacher, I have only myself to blame for failing to take into account the range of likely outcomes of my classroom experiments. “The central thesis of this paper”, the authors write, “is that the proper amount of data for many classroom demonstrations can and should be calculated prior to conducting the demonstration in class.” (Good point, noted.) As one of the types of experiments that definitely require such prior calculation, they list inductive approaches to formulas. “Clearly, if too few trials are run, the estimate […] may not approximate the theoretical probability; as a consequence, no intuitive insights will be gained.” (Well, clearly.)
In their concluding remarks, the authors address instructors who “determine the amount of data to collect by letting the size of their class dictate the N they end up with.” (Wonder who would do such a thing.) The final paragraph reminds those lazy sods why they should know better: after all, by determining the ‘proper N’ in advance, “the instructor uses the content of his or her discipline” (ouch), “helps to make the teaching process a bit more scientific” (oomph), and, obviously, “decreases the chances that ‘uncooperative data’ will produce frustration and embarrassment.”[1]
In larger groups, or with less time pressure, there are ways to avoid this embarrassment. Math teacher Darin Beigie, for example, gave his students a homework task in which they had to sum the results of two D6 rolls a hundred times and, in pairs, enter the frequencies of the sums in a shared spreadsheet.[2] Combining the results of three classes gave him and his students 2400 (double) rolls to work with. It’s an excellent idea. Even so, when his students repeated the experiment with a D4 and D8, the results displayed a noticeable aberration compared to the theoretical probabilities: 5, 6, 7, 8, or 9 are all equally likely sums, but it is very unlikely for the experimental results of all these rolls to be the same or imperceptibly different. Pace Huck et al., the ways in which minor aberrations can present themselves as tempting visual patterns are hard to enumerate in advance, making it difficult to do the math on them.
In Beigie’s experiment, the graph exhibited a small dip in the middle, which does not seem to have confused his students (489). No harm done, then; and I wish I had thought of this idea of probability experiments as homework sooner. Admittedly, there are also reasons why it can be good to be present while the students are doing their experiment: to make sure that the book-keeping is going well, to see how they interpret their initial findings, or even just because it is a lot of fun to observe the activity.
As a case in point, the most exciting experiment with probability experiments in the classroom that I know of was done by the teaching couple Nadine and Guy Brousseau. It spanned several dozens of sessions, and revolved around the problem of finding out how many black and how many white checkers pieces a bag contains, given that there are five pieces in total, when you can only take out and inspect one random piece at a time. The description of the experiment by Guy (written up and translated to English a few decades after the fact, based on notes kept by Nadine, who taught the series) is great fun to read.[3]
Their experiment is striking in its duration and subtlety, and also a disciplined exercise in constructivist pedagogy. Not only does the teacher not directly contradict the false ideas of her ten-year-old students, such as the thought that after a few black pieces, “the whites are about to have their turn” (367); but at no point does she open the bags. The students have to convince themselves and each other based just on the experiments they do on the three different bags that the teacher brings to every session.
This makes the first few phases very sensitive to statistical fluctuations: the students are inclined to jump to (deterministic) conclusions about patterns that suggest themselves in the first handful of draws. Guy notes Nadine’s “concern over not seeing the characteristic events of the process realized”, the characteristic events being those supposed to drive the students’ thinking forward.
For example, the appearance of a series of five whites from the (4w, 1b) sack at the moment when its usefulness in the children’s reflections had been mentioned had only one chance in three of happening. But this event has a good chance (nearly 9 out of 10) of happening in the course of five or six draws, which the process provides at that moment. The permanent presence of researchers who had calculated the situations and evaluated the risk of things going wrong proved nearly indispensable for relieving the teacher of the responsibility for an evolution which she feared would escape her control, for exploiting certain opportunities and for continuously explaining the development of the learning. (406)
Multiple sessions are devoted just to drawing series of five from each of the bags, and forming ideas about how to move from these draws to conclusions about the number of white and black pieces in the bags. The students, for instance, decide to ignore draws that have five identical colors: they know from previous draws that each bags contains both colors, so 5-white or 5-black draws are “false”. To decide between the others, a student proposes to go with the composition that is drawn the most frequently, until it beats every other one by a difference of two. This works to the group’s satisfaction for one bag, but seems to force a conclusion that doesn’t feel right for the other bag.
This phase must have been especially nerve-racking for the teacher and the observers (Guy calls this part of the experiment “terribly ambitious and perilous”). Relatively small chance events influence the group’s sense of success and openness to new approaches. As it happens, different students do come up with vital new ideas: adding up the blacks and whites from all draws; and preparing their own bag with known contents, to see how the draws from those bags behave. Although in a later session, they temporarily revert to counting how frequently different combinations of 5 pieces occur, the idea has taken hold that longer series of draws provide more confidence: “they can’t reach any conclusion after 15 draws, so they ask to do 150.” (382) Though the results now convince the students, the teacher nudges them back to the other path they had started to take earlier: add up the numbers from different draws, and ‘compare’ them to the total number of draws. In the next three sessions, the students get to work on performing the relevant additions and divisions.
Here, finally, we get to sample sizes where the teacher does not need to worry about ‘uncooperative data’ anymore; instead, she now has to worry about uncooperative students. By session eleven, the little data workers get tired of all the manual computations. They complain they are now sure of the composition of the bags and start demanding the teacher open them. She refuses. “The situation becomes strained”, we read; “the students consider that there has been a sort of breaking of a contract by the teacher.” (387)
In subsequent sessions, new tools are introduced: graphs are drawn, a computer is brought in to simulate draws, and the students will think about what results would lead them to what conclusions (and with how much confidence). The students, who had craved new perspectives, ideas and insights that rendered their calculations meaningful, forget their fatigue with the project, and are engaged again.
It is a reminder that the teacher cannot simply optimize for the probability of the experiment giving the desired outcome; other parameters, including student understanding and motivation, always need to be taken into account. All the more reason to heed the admonitions of Huck, Clark and Ranney, about being conscious of the relevant probabilities; but when the stakes are low and there is more to be done, a quick high-risk activity may sometimes be justified.
My visitor seems to agree. After granting me the teaching permit, he informs me that he is an enthusiastic lottery player. The moral of the lesson on expected values has been heard and understood, but he plans on staying his course and beating the odds. I wish him the best of luck.
[1] Schuyler W. Huck, Sheldon B. Clark, Gipsie B. Ranney, ‘Estimating the probability of success for classroom demonstrations in statistics’, Journal of educational statistics 10.3 (1985) 239-251.
[2] Darin Beigie, Gwen Johnson, James Dogbey, ‘Mathematical explorations: probability experiments with shared spreadsheets’, Mathematics teaching in the middle school 15.8 (2010) 486-491.
[3] Guy Brousseau, Nadine Brousseau, Viriginia Warfield, ‘An experiment on the teaching of statistics and probability’, Journal of mathematical behavior 20 (2002) 363-411.