
by Derek Neal
 We have many choices when deciding what to eat. For most of human history, however, there has likely been little to no choice at all: people ate what was available to them or what their culture led them to eat. Now things are not so simple. As I mentioned in Part 1, people go to great lengths in organizing and planning their eating, whether it be by using meal preparation kits, following a restrictive diet, or adopting another culture’s cuisine as their own. Another way of deciding what to eat, and this way will be recognizable to most, is by following the food pyramid. Once ubiquitous, the pyramid has largely gone out of fashion, and in fact it was replaced by the much less memorable “MyPlate” graphic in 2011. The pyramid and plate graphics are part of the United States government’s nutrition guides, which can be broadly taken as indicating the general public’s understanding of and relationship to food. This is not to say that most people try to achieve the guidelines set out by the pyramid or the plate, but that in examining how food is represented graphically—in a hierarchical fashion with the pyramid or in an individual fashion with MyPlate—we can see how Americans conceive of what food is (or how the government thinks Americans ought to understand food), and how this has changed over time.
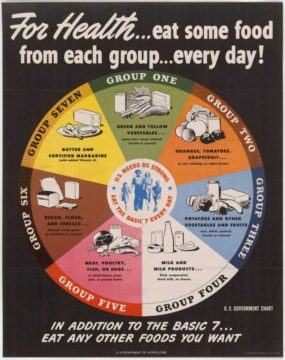 While some version of a nutrition guide has been published since the late 19th century, the first visual guide was produced in 1943. This guide differs drastically from later guides in that it doesn’t make distinctions between “good” and “bad” foods or “staples” and “indulgences.” Instead, the guide is a circle split into seven equal sections with no section taking precedence over the other. “Butter and fortified margarine” has the some importance, apparently, as “green and yellow vegetables.” Under the image, some versions of the guide feature the message, “In addition to the Basic 7…Eat any other foods you want.” The guide is permissive, not restrictive. It features minimum amounts that one should eat (above the image it says “For health…eat some food from each group…every day!), not maximum amounts that shouldn’t be exceeded. In addition, calories and macronutrients are not specified—“some” is the only indication of quantity. In this way, the 1943 food guide does not posit food as something to be restricted; in fact, it doesn’t seem to be overly concerned with an individual’s “relationship” to food at all. This image may strike us as naïve or inadequate, but to me it indicates an understanding of food that we would do well to recover. After all, the American public’s health has only decreased in the proceeding years, and this in spite of large improvements in our understanding of nutrition and diet. The most interesting part of the graphic is the center of the circle, where we see a family—husband, wife, son, and daughter. The suggestion, perhaps obvious to people at that time, is that food is a family affair, not an individual activity.
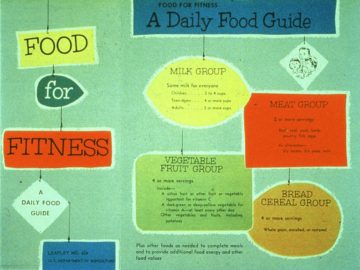
In the mid 1950’s, a new food guide was produced which reduced the seven food groups to just four—milk, meat, vegetables/fruits, and breads/cereals. This guide maintains certain features of the 1943 guide, such as featuring the image of a family, but it also makes interesting changes, such as specifying minimum quantities of each food group. For example, instead of “some” meat, the guide instructs Americans to eat at least two servings. At this point, maximum limits still have not been imposed; for each group the instructions are “two or more servings” and “four or more servings.” At the bottom of the guide, a message reminds us that we can also eat “other foods as needed to complete meals and to provide additional food energy and other food values.” This guide is still a permissive one that does not restrict how much one may eat, but in specifying minimum servings and reducing and moving the picture of a family to the periphery of the graphic, it precipitates changes made in later food guides.
 The next graphic food guide appeared in 1979. This one, called the “Hassle-Free Daily Food Guide,” builds upon the changes made in the 1950’s guide. The family has been eliminated altogether, and even the name “hassle-free,” implies that food is something burdensome, not something that might be enjoyed collectively. In addition, a fifth category has been added, “Fats, Sweets, Alcohol,” and over the image of bottles of oils and liquor has been laid a large yellow “CAUTION” sign, akin to one that might be seen while driving. Best steer clear of these foods, lest you enjoy them. Here, then, is the first indication that some foods are “good” and some are “bad,” that some foods must be limited while others can be consumed freely. Gone as well is the additional text on previous graphics that reminded us additional food was to be eaten as one desired.
 The 1979 guide, which featured much more text and was less visually appealing than previous guides, was quickly updated in 1984 by the “Food Wheel.” Unlike the previous circular graphic from 1943, this image does not feature equal sections. Instead, the size of the section is based on how many servings one should eat of the food contained in the section. Thus, “Alcohol, Fats, Sweets” represents a sliver of the circle, along with the word “moderation,” while “Breads, Cereals, Grains” represents a large slice of the pie, along with the indication “6-11 servings.” Here as well is the first time that upper limits are imposed on one’s eating habits. The removal of the text telling one to “eat anything else you want” hinted at this change, but here it is made explicit.
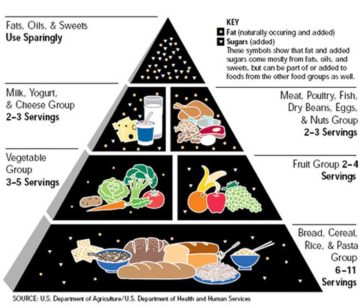
In 1992, the iconic Food Pyramid (see image at top) was introduced. It is quite similar to the Food Wheel in its food groups and serving guidelines, but its main innovation is clearly in its shape. By using a pyramid, it becomes much easier to visualize which foods are favored and which ones are restricted. The top of the pyramid, containing “Fats, Oils & Sweets,” seems out of reach, just like a cookie jar on the top shelf. And in representing the food three dimensionally as opposed to in a two-dimensional triangle, it seems physically exhausting to reach the top. The pictures of oils and alcohol have even been removed and replaced by circles and triangles. There really is no place for indulgences with the Food Pyramid.
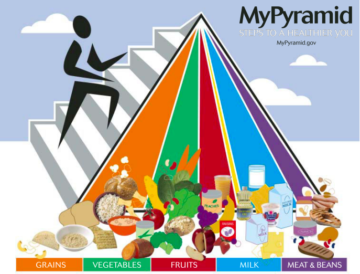 The original Food Pyramid lasted until 2005, when it was replaced by MyPyramid, an updated version. In this new pyramid, the focus on the individual has become even more apparent, not only in its name, but also in its slogan, “Steps to a Healthier You,” and in the image of a person walking up the pyramid. Unfortunately, there’s no reward at the top for this climber: the category of “Fats, Oils & Sweets” seems to have been eliminated, and all that remains is a small sliver (the pyramid is divided vertically) represented by a picture of vegetable oil. Not very appetizing. The other groups remain, along with precise recommendations for serving sizes according to a 2,000-calorie per day diet (on a separate page). A range of servings, such as the two to four servings allowed for fruit in the Food Pyramid, has been made more precise, and this additional page to the MyPyramid graphic states that one can “find the amounts that are right for you” by going to its corresponding website. When comparing this graphic to the original 1943 graphic, the differences become stark: in the first graphic, food is consumed in a family and one can eat whatever they want, as long as they make sure to eat a little bit of everything; for this graphic, food needs to be calibrated at an individual level to maintain optimum health, and there are certain foods that can’t be eaten, while most must be consumed without surpassing certain limits.
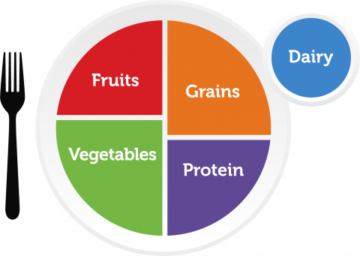 The current food guide, introduced in 2011, continues the trend toward individualization. “MyPlate,” as it’s called, is visually surprising and drastically different from previous food graphics: it doesn’t feature any pictures of food. Whereas most previous graphics featured an abundance of food in an often appealing way, this graphic features wedges that represent portions of a plate. There is a wedge for fruits, vegetables, grains, and protein. Not only have images of food been removed, but actual words denoting food have disappeared as well. The “Meat and Beans” group from MyPyramid is now “Protein,” the “Bread, Cereal, Rice, and Pasta” group from the original Food Pyramid is called “Grains,” and the “Milk” group is now called “Dairy.” The sliver that once represented “Fats, Sweets, and Oils” is nowhere to be found.
Frankly, I find this depressing. It is as if food, real food, has disappeared from considerations of eating altogether. The image is a lonely one, a solitary plate of variously colored wedges. Who wants to eat that?