
by Malcolm Murray
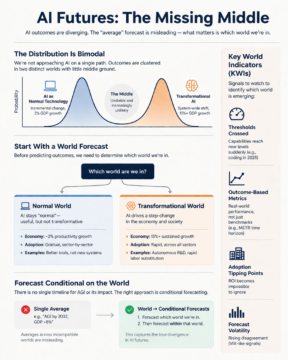
In forecasting the evolution of AI, we are rapidly losing the middle. The outcomes are diverging to the extent that it no longer makes sense to think about “an average timeline” or “average outcomes”. Many people are now tracking prediction markets for when “AGI” will arrive. The current Metaculus prediction is for July 2032. But nothing will happen in July 2032 specifically. The median is irrelevant. Similarly, the average outcome on the economy from advanced AI might be an increase in GDP growth by 8%. But it is looking much more likely that we will either have unprecedented 15% annual growth or continue on the long-term trajectory of 2%. Averaging across two worlds that cannot exist does not create a realistic world. It is like the old joke of how the average income changes when Bill Gates walks into the bar. The average income might have gone to a billion each, but that does not mean that any one specific person in the bar has one billion.
What matters is the distribution, not point estimates. Toby Ord recently took a step in this direction and discussed using broad timelines for transformative AI (instead of short or long ones), and plan for all potential outcomes across those timelines. We should probably go even further. It might not even be enough to look at one probability distribution for advanced AI, even one that is very bimodal. The outcomes might be distinct enough that we should be looking at several, completely different distributions. When one of the possible worlds includes hitherto-unimaginable characteristics such as the world economy doubling every few years, it has very little in common with other worlds.
World forecasts and object forecasts
This means we should stop looking only at median forecasts, such as the AI 2027 scenario from last year. Its authors have been at pains lately to try to explain that 2027 was the median, not the key prediction. There is no median AGI. What we should do instead is to start forecasting on two distinct levels. First, we need to forecast which world we are in, and only then, conditional on that, we forecast within each world. We can call these world forecasts and object forecasts.
This is something that LEAP does very well. This is a longitudinal AI forecasting study that I am part of. It is run by the Forecasting Research Institute. They often start with positioning different worlds (e.g. slow, medium or rapid AI evolution) and only then, conditional on that being the world we are in, we do forecasts on the relevant characteristics of that world. For example, in a rapid AI evolution world, what share of total income will go to labor vs capital, a hotly debated question.
This could start to capture the fact that we are dealing with two very distinct worlds in future AI, increasingly little in-between these two. One, we have the world in which AI radically transforms the economy and society, and two, the world in which AI is just “a normal technology”. This pushing toward the extremes is not something unusual, we have seen this in past decades in everything from political polarization to winner-takes-all dynamics in many industries. For AI, however, it is driven by different mechanisms.
Phase changes and tipping points
AI is characterized by phase changes and tipping points both on the “supply side” and the “demand side”. On the supply side, AI capabilities, these evolve in a lumpy fashion. Like water going from not boiling at 99 degrees to suddenly boiling at 100 degrees, AI capabilities go from being not useful to very useful, without passing the middle. We saw this with AI’s coding capabilities. The threshold was suddenly passed in 2025. Coding abilities went from unreliable and hard to use to suddenly so reliable and useful that leading AI labs handed over large parts of their code to autonomous AI. We spent hardly any time in the middle of semi-autonomous and somewhat reliable, coding. Earlier, the same happened with image generation. We went from a long time having 3-fingered, highly unrealistic people to complete photorealism without passing a stage of people that are just somewhat off.
On the demand side, real-world adoption from companies, the same dynamics play out. There are tipping points when the ROI for companies to implement AI simply become impossible to ignore. Similar to how Covid passed a tipping point when its spread was suddenly undeniable, we are likely to see the same kind of step change in adoption. It might not be because of a single capability, but because the set of capabilities, together with scaffolding and tools, suddenly crosses a threshold. Then AI goes from taking more time to fix the errors to suddenly too valuable to not use.
Key World Indicators
We need therefore to first determine which world we are in in order to then forecast within that world. For this, we will need signals telling us which world we are in. Similar to Key Performance Indicators (KPIs) and Key Risk Indicators (KRIs), we could think of Key World Indicators (KWIs). These should give us clues ahead of time as to whether we are in the transformational or normal world.
Most AI progress is captured in benchmarks, but they are not useful for this purpose. They mostly look only at single capabilities, they are not leading indicators and many are also already saturating. A better option is to look at measuring outcomes, as a result of a combination of capabilities. The famous METR time horizon chart, while suffering from a small sample size at the extremes, is a good example of this, as it measures an outcome – the model maintaining consistency over a time horizon.
Capturing thresholds per se would also be good KWIs, as they can signal a state change. AI companies have been making use of thresholds in their Frontier Safety Frameworks. As long as these are clearly defined and measurable, the passing of a threshold can be a good signal that we are moving from one AI world to the other. Ajeya Cotra recently forecast 10% likelihood that we would have fully automated R&D this year. Her definition, that progress would continue in the hypothetical world where all humans get fired, is somewhat unmeasurable. However, if made more measurable, this would be a clear indication of a phase change – a change between worlds and not only within worlds.
A good type of leading indicator could be derivatives of forecasts themselves. In stock markets, there is VIX, measuring volatility. One could look at a similar measure for the volatility of forecasts, especially at the world-level. With the growing amount of liquidity in prediction markets, that might soon be a possibility. Similarly, an option could be using the second derivative, gamma. This would look at the speed of change and how much change is speeding up or slowing down.
An average forecast of 8% GDP growth does not let you take any action. It is a world that will not happen. However, creating world forecasts and conditional forecasts within those worlds could help decision makers better plan for these highly different outcomes. Even better, developing a set of Key World Indicators, like we have for earthquakes, could start giving us early warning signals of whether AI might soon rock our world.
Enjoying the content on 3QD? Help keep us going by donating now.