
by Jonathan Kujawa
A few hours’ drive north of my home is the Laser Interferometer Gravitational-Wave Observatory (LIGO) in Hanford, Washington. LIGO was designed and built to detect gravitational waves. When the LIGO project was started in the 1980s, gravitational waves were a purely theoretical phenomenon predicted by Einstein’s theory of general relativity.
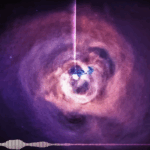
General relativity says that gravity should be understood as the deformation of the geometry of spacetime. If, say, two massive objects, like a pair of black holes, should collide, then this should cause waves to ripple across the universe. With enough care, we just might be able to detect these waves.
This is just the sort of large-scale, curiosity-driven, speculative research that depends on the support of far-sighted government funding agencies [1]. Over the course of several decades, the United States’ National Science Foundation funded many hundreds of researchers to make the pipe dream of gravitational wave detection a reality. In 2015, they succeeded. In my lifetime, we’ve gone from gravitational waves being purely theoretical, to detecting them, to being able to listen to them on our home computer. All thanks to decades of work by numerous researchers funded by the NSF and their home universities.
It so happens that one of those researchers was a friend of mine, Rauha Rakola. We did our undergraduate and graduate degrees at the same universities, me in math and him in physics. Rauha’s PhD thesis developed some of the theoretical and computational physics needed for gravitational wave detection. It took more than a decade from his thesis until gravitational waves were first detected — research is not for the impatient!
If we stopped after detecting a gravitational wave, that would be an impressive feat of engineering and physics, and an important contribution to our understanding of general relativity and the fundamental nature of the universe. But human curiosity and ambition know no bounds. Just as you could imagine using the size and shape of waves lapping at your feet to learn about a large ship that passed by (or an earthquake on a distant continent), we should be able to use gravitational waves to learn something about distant objects. The success of LIGO spawned the new field of gravitational-wave astronomy.

The root of all these questions is a famous problem in mathematics studied for more than a century. I learned about this area of math from a great talk at my university by Liz Stanhope of Lewis and Clark College.
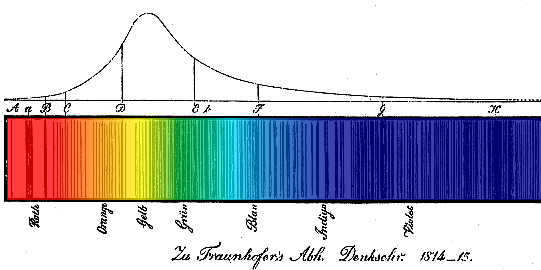
In the 1700s, Comte de Buffon [3] apocryphally stated: “Of one thing I am certain, we will never know what the stars are made of.” Fraunhofer then mapped the spectrum of the light coming from the sun, and by the mid-1800s astronomers were able to use this data to determine the sun’s composition.
We now use similar techniques to describe the atmosphere of planets in other solar systems. We’ve done remarkable things with light waves.
When it comes to other kinds of waves, it has been more of a challenge. In 1882 Arthur Schuster remarked:
We know a great deal more about the forces which produce the vibrations of sound than about those which produce the vibrations of light. … but it would baffle the most skillful mathematician to solve the inverse problem and to find out the shape of a bell by means of the sounds which it is capable of sending out.
In math, Mark Kac famously framed this problem in 1966 as: can you hear the shape of a drum? Right now, the answer is sometimes yes, sometimes no, and sometimes nobody knows.
Mathematicians have reframed this problem by asking what you can learn about the shape of an object if you know the spectrum of the Laplace operator for that object.
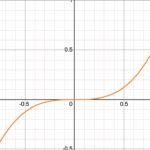
For those who are interested, the “Laplace operator” is a fancy name for what amounts to the second derivative from Calculus. If you took Calculus, you might remember that the second derivative tells you about the “concavity” of a curve, and concavity is about the shape of the graph. When you look at y=x³, if you are left of x=0, the graph has a downward bent shape; we say the graph is concave down, and you can detect this by knowing the second derivative of x³ is 6x, which is negative when x is a negative number. Likewise, if x is positive, then the second derivative is positive, and the graph is concave up — meaning it has an upward bend to it. This line of thinking leads mathematicians to expect the Laplace operator to tell us about the shape of an object, and the key numerical data describing the Laplace operator is called its spectrum. Those values are the mathematical equivalent of the black lines in the Fraunhofer image above.
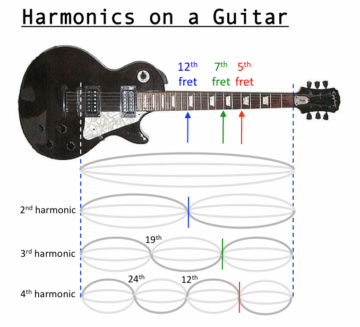
The first version of this problem is a single guitar string. The main dimension of a string is its length. If we had the recording of a plucked guitar string, could we use mathematics to tell how long it is? Yes, we can!
The spectrum tells you the harmonics of the plucked string, which, in turn, can be used to determine its length. Roughly speaking, as waves move through the string, if they are precisely matched, they can either work in unison and amplify each other, or work against each other and cancel out. But the journey of a wave down the string depends on how the length of the wave compares to the length of the string. Knowing the waves and knowing where they amplify and where they cancel tells you how long the string must be.
The answer is: sometimes yes, sometimes no. Not surprisingly, this is a more challenging problem. Like on the surface of a lake, now waves can move across the surface and interact with each other in significantly more complicated ways.
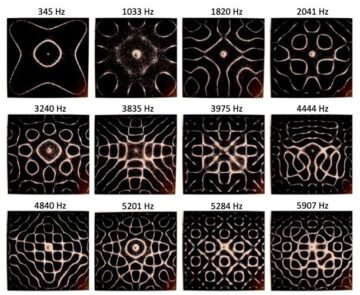
The simplest version of this problem is to use a single plate of steel or other metal, called a Chladni plate. Both the shape and the material are as consistent and uncomplicated as one could hope for. Even still, if you make the plate vibrate, you will quickly find that the waves reinforce and cancel each other in beautifully unexpected ways. Properly tuned, like the guitar string, the waves in the plate will form harmonics. To reveal this to the human eye, people usually put a layer of fine sand or a liquid on the plate. As it vibrates, the sand or liquid will wander away from the vibrations and into the calm spots:
This crossover between art and mathematics is sometimes called Cymatics. Nigel Stanford made a cool music video using Chladni plates and more to visualize harmonics. He also made a great “behind the scenes” video giving details on how they got it it all to work.
The Laplace spectrum captures the dimension of the vibrating shape (so it can tell between a string and a plate), and it also can tell you the size of the shape along with the size of its boundary. This means that I can tell you are using a two-dimensional shape and, if you tell me it is a square, I can tell you its area and perimeter and, hence, can figure out how big the square is. Even if I only know that it is a rectangle, the area and perimeter, plus some algebra and elbow grease, are enough to tell me its length and width. Likewise, the area and perimeter are enough to determine the size of a circular drum.
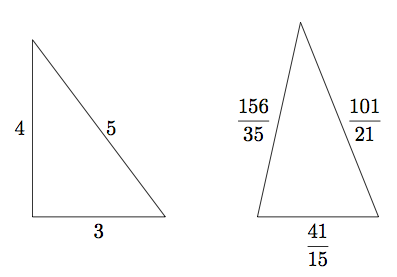
On the other hand, if you tell me it is a triangle, just knowing the area and perimeter is not enough. It turns out that two different triangles can have the same area and perimeter [5].
However, not all is lost! As you see above, guitar strings and Chladni plates have many, many harmonics. Likewise, the Laplace spectrum has infinitely many values. There is a lot more information in it than just the area and perimeter. In her 1988 PhD thesis, Catherine Durso proved that with the area, perimeter, and a bit more information extracted from the Laplace spectrum, you can actually determine a triangle by how it vibrates [6].
At this point, you might start to think that any two-dimensional shape can be determined by its spectrum. However, in 1996 Caroline Gordon, David Webb, and Scott Wolpert proved this is a false hope. These two shapes have identical spectra:

If you had your eyes closed, you wouldn’t be able to tell which one I was playing.
This is an active area of research to this day. Dr. Stanhope, her collaborators, and other researchers continue to investigate what can and can’t be said about a shape based on its Laplace spectrum.
And, of course, in applications, we can often do much better because we still gain even with incomplete answers. If an ultrasound can describe a shape up to a tiny amount of possible error, that is plenty good enough to determine if a lump needs further investigation as a possible tumor. And any information that gravitational waves can tell us about mysterious black holes is welcome.
On the other hand, given Gordon, Webb, and Wolpert’s example, I’m confident we still don’t know the answer to Schuster’s challenge from 150 years ago to describe the shape of a bell by the sound it makes.
And even if we someday can do a bell, it will be a long time before we understand how Wing can make this song using only his voice.
[1] Just this week, the federal government froze all research grants to UCLA. Once again, people are being bludgeoned by the power of the US government to make a political point. Needless to say, the research and researchers hurt by the freeze have little or nothing to do with the politics involved.
This freeze was especially upsetting for me as it included the funding of the Institute for Pure and Applied Mathematics (IPAM). In mathematics, getting together to talk mathematics with others at the cutting edge is essential. IPAM hosts conferences and workshops that are highly impactful. I attended an IPAM workshop in January 2024, where I learned new techniques that are now central to my graduate student’s PhD thesis research. These sorts of events are also an important opportunity for young mathematicians to learn about both their field and their community. I met a number of grad students and postdocs at the IPAM meeting, and might not have known about them otherwise.
The loss of IPAM is a significant blow to mathematics. Even if the freeze is temporary, the damage will quickly accumulate as new ideas die on the vine and young careers are stunted.
[2] Charles Brooks makes amazing photos of the inside of musical instruments. Image borrowed from this article.
[3] This is the same Buffon of Buffon’s needle and noodle fame. We touched on them here at 3QD.
[4] Image borrowed from here.
[5] If you’d like to know more about where these two triangles came from, I recommend this blog post to you. The author explains that you can travel through the “space” of triangles in a way that preserves area and perimeter, and how to use this point of view to find examples like the one above (that I borrowed from the blog post, of course!). If you are interested in thinking about all triangles as a world to be explored, we touched upon this idea some years ago at 3QD.
[6] This paper provides the technical details, if you’d like to see the gory details.
Enjoying the content on 3QD? Help keep us going by donating now.